

The Cartography & Geographic Information Society
- Tweets959
- Following330
- Followers2.2K
- Likes186







ALT Figure 1. Three types of mobile map adaptations (adaptable, adaptive, and mixed-control) dependent on the distribution of initiative, execution, and control of the map adaptation between the map user and the system. Alt text: A smartphone map (visualization, interface, content) above icons for initiative, execution and control. A left arrow leads to Adaptable mobile map: full user control, e.g. users modify the map to their needs. A right arrow leads to Adaptive mobile map: fully automated, system-controlled adaptation, e.g. the map adapts to use context. A down arrow leads to Mixed-control adapted mobile map: any user-system combination of initiating, executing and controlling, e.g. user-initiated but automatically executed.

ALT Figure 3 shows how a road network is converted into a dual graph in two steps, read left to right. a) A simple network of two horizontal roads, a vertical road crossing both, and a short vertical spur below the lower road, with dark red dots at road endpoints and junctions. An arrow labelled “Road midpoint extraction” leads to b), the same network with eight orange dots, one at the midpoint of each road segment. An arrow labelled “Dual graph construction” leads to c), where the midpoints become eight red nodes, with the original roads faded to grey. Blue edges link nodes whose road segments meet, forming a connected graph of triangles and quadrilaterals. A legend identifies road endpoints, road midpoints, dual graph nodes, and dual graph edges.

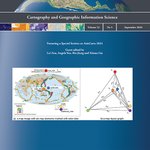
ALT Front cover, for Cartography and Geographic Information Science, Volume 53, No 5, September 2026, The Journal of the Cartography and Geographic Information Society. Includes Figure 1 by Yang et al. A sample of map layout graph construction, which is a research diagram illustrating map layout graph construction. Part a) shows a world map of seismic activity with 6 colored markers representing different elements on the map. Part b) transforms these into a graph theory representation where elements become vertices (v1-v6) connected by edges showing relationships.


ALT Figure 3: Representative composite heat maps of visual attention during map-based navigation tasks 2-4, comparing a) a poor-SD (spatial disorientation) participant and b) a good-SD participant. Both maps show the same urban area with streets, parks (green), water (blue), and numbered points of interest (1-10 and A-D). Starting and end points are labeled. Heat map colors indicate visual attention intensity: orange/red shows high concentration, blue shows low or no attention. The poor-SD participant's map displays concentrated orange/red clusters throughout, suggesting scattered attention. The good-SD participant's map shows dispersed blue tones with subtle patterns, suggesting more systematic scanning. Each map includes a north arrow and 1:20m scale bar. The comparison demonstrates differences in visual attention patterns related to spatial disorientation abilities during map-based wayfinding.

?' (08:19 PM), followed by 'Executed: addWFS('states', '[http://loca](https://pbs.twimg.com/media/HE0wrchXgAAeLvD.jpg?name=orig)
ALT Figure 6: Example of autonomous GIS operation where the fine-tuned SLM translates natural language queries into executable functions (addWFS and SetStrokeColor), updating the map visualization in real-time. The screenshot shows the AWebGIS App interface with three main sections: 1) A left sidebar containing 'Analysis Tools' and 'Layer Manager' panels, with options to 'Add WMS', 'Add WFS', 'Import', and 'Add Base', plus layer options for 'states', 'wfs', 'OpenStreetMap', and 'base'; 2) A central map display showing a base map of North America with the United States outlined in red stroke, including state boundaries and the Great Lakes region; 3) A right sidebar with 'Chat Assistant' and 'Activity Log' tabs, showing a conversation thread with timestamps. The chat displays natural language commands such as 'Can you add 'states' layer from [http://localhost:8080/geoserver/cite/wfs](http://localhost:8080/geoserver/cite/wfs)?' (08:19 PM), followed by 'Executed: addWFS('states', '[http://loca

ALT Figure 2: Conceptual workflow of the autonomous web-based geographical information systems (AWebGIS) approaches. The diagram shows a natural language query at the top splitting into two parallel processing paths. Approach I (Cloud-based LLMs), shown on the left in a dashed box, follows this sequence: 1) Natural-language query sent via HTTP to cloud API (OpenRouter to DeepSeek V3.1); 2) In the cloud, DeepSeek Chat V3.1 translates the query into a GIS function call using few-shot learning; 3) Predicted function call is returned as a text string to the web browser; 4) The JavaScript engine parses the function call and executes the corresponding GIS operation. Approach II (Browser-executable SLMs), shown on the right in a dashed box, follows this sequence: 1) Natural-language query processed locally through fine-tuned SLMs (e.g., T5-tiny); 2) In the user's web browser, an SLM translates the query into a GIS function call; 3) The JavaScript engine parses the function call and executes the c

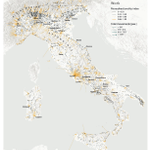
ALT Mobility resultants for Italy, work commuting, year 2011. Labels refer to places mentioned in the text. The map displays Italy with terrain shown in light gray and major cities labeled including Milan, Turin, Venice, Bologna, Rome, Naples, Palermo, and others. Orange flow lines represent commuting patterns between locations, with line thickness indicating volume of movement. The legend shows two classification systems: 'Monodirectionality index' (0-0.33, 0.33-0.50, 0.50-0.66, 0.66-1.00) and 'Total movements [pax]' (1-257, 257-614, 614-1577, >1577). Strong commuting corridors appear around major urban centers like Milan and Rome, shown by prominent orange flow patterns radiating outward. Regional annotations identify areas like Rimini, Ancona, Cagliari, and Bari. The visualization demonstrates uneven geographic distribution of work commuting, with concentrated patterns in northern industrial regions and more dispersed patterns in southern Italy.

ALT Front cover, for Cartography and Geographic Information Science, Volume 53, No 4, July 2026, The Journal of the Cartography and Geographic Information Society. Includes Figure 6 by Yang et al.: (in this issue) System interface (an example of “Statue of Liberty” map color design). a) Conversation view: users can input their initial design intents and customizations in natural language. b) Color design view: users can fine-tune the intermediate results generated by the LLM. c) Map view: users can evaluate the results with reasoning and refine the color assignments based on their preferences.

ALT Figure 4. Examples of deepfakes generated with PatchMatch. Real image (left, small) and the deepfake (big, right) produced by PatchMatch for urban areas. The real image includes a red house, which is removed in the fake image, replaced by green lawn.

ALT A series of 6 maps with different color selections, with scores ranging from 2.10 to 4.00 (out of 5) with true value (scored by a survey) and predicted value (predicted by a color preference evaluation model)