

Publication quality weather maps in seconds. Pyre is a Climatology Reanalysis mapping site using CORe data. Help us get better with feedback!
Pittsburgh, PA
Joined October 2026
- Tweets193
- Following260
- Followers91
- Likes324




After our Fox Weather guest invitation, I checked the backends to make sure we were ready for increased traffic. If you experienced this error signing up with Google, it's been fixed and please try again!

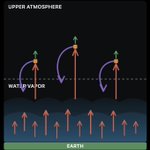
There is a debate right now happening in response to the US head of climate change, who has been described as a climate denier. He makes a simplistic argument for un-regulating methane gas emissions saying it's not a significant contributor as a green house gas. (cont)

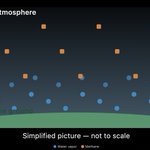
What Dr. Wielicki's tweet leaves out is that while water vapor is abundant near Earth's surface, its concentration drops dramatically with altitude. Methane remains present higher up, where it's contribution compared to water is nearly the same.


Methane does not condense. It is present throughout the atmosphere. the diagram here is conceptual. At higher levels in the atmosphere, methane significantly outnumbers water.


PyRe Weather retweeted

Sigh

We're only about a week away from the full operational debut of the RRFS and REFS models and the retirement of the NAM, HRW, SREF, and HREF models. Currently working on a video that will discuss what's changing, why NOAA is making these changes, the timeline behind how we got here, and some nuances of the RRFS/REFS that might be useful when forecasting in the future. Stay tuned.

Evolution of summer heat from June through September, 2026. What's interesting is the most intense heat anomaly started in the Canadian arctic region in June, and never fully went away. Greenland and Alaska alternated hotter and cooler 1/X

these are anomalies, not actual temps but how cool there is a persistently cooler layer of the atmosphere at 200mb that solidly separates troposphere from stratosphere. But these temp anomalies don't nicely correspond with the GPH changes. Hmm.

Meanwhile on Sept 19th, a faster jet stream (lower graph) builds up while polar cap stratosphere shows brief lowering of GPH as well. Lets look next at what the actual temperature was doing, and if it correlated with the height anomalies at al

Sun dogs / Moon dogs are a good travel omen!
brilliant photos of them shared by James Span

Look up tonight! If you see bright spots on either side of the moon, you’re looking at moon dogs.
They’re the nighttime version of sun dogs. Same idea: thin, high cirrus clouds made of tiny six-sided ice crystals. Moonlight bends as it passes through those flat, plate-shaped crystals, and piles up into bright spots 22 degrees on either side of the moon, at the same height as the moon.
They’re fainter than sun dogs because moonlight is so much dimmer than sunlight — but with the moon still nearly full after last night’s Hunter’s Moon, and thin cirrus overhead, they’re showing up nicely tonight, some with a little color on the edge.
Same sky, same physics, just moonlight doing the work. Beautiful stuff — step outside and take a look!


PyRe Weather retweeted

This is unreal to me. 1) Implications of a cold early winter in Europe: next to no one cares, with NG filled to less than capacity. 2) Correlation of a strong El Niño in December and Europe showing the opposite. So why does no one care? But post something that has nothing to do with what I am trying to show people most of the time with weather and climate examples, and boom, most likes and views ever. How the heck is that even possible? The other 2 are much more important for early winter implications. And I am mad because I will show stuff and then have to go back and ask Grok when I showed it, when people are asking me questions about what I have already shown. And now I have proof of why. it will censor stuff about weather and climate ( that Euro Gas is very important given the neg AO that is trying to set up, but somehow copying something from my buddy with a lot of non-weather, but political points gets it to show it to everyone


Can you break our charting tool? We need feature testers! While working on new visualizations, we don't want release them until the interface is tested and the mathy stuff is correct. if you'd like to be tester, please check the first comment!

We'd love to have you, but first please send this account or @SteelCityCoach a DM so we know you're not a bot.
Join the server here:
discord.gg/dQQ4yna5m
If you're already a follower of either account we'll get you added right away
(DM if expired)