
Canada's National Statistical Agency. Terms of use: https://xitter.gq/t.co/OqJBO3JRyg Français: @StatCan_fra
- Tweets31.1K
- Following155
- Followers221K
- Likes2.7K







ALT Now available: check out the first suite of geographic products released from the 2026 Census.

ALT The Canadian Statistics Advisory Council’s 2026 Annual Report - Data Under Pressure: Sustaining Canada’s Statistical System.

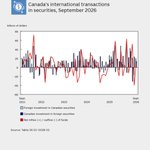
ALT Chart showing Canada's international transactions in securities in September 2026. For a detailed description of the visual elements found in this image, see link in caption.

ALT New data literacy trainings available: Introduction: What are Data?, The Four Steps of the Data Journey, Analyzing and Interpreting Data, and Telling the Data Story. Access the courses through the link in the caption.

ALT Consumer Price Index October 2026. Increase of 2.0% in food purchased from stores. Increase of 1.4% in shelter. Increase of 8.9% in transportation.

ALT The Weekly Review, November 9 to 13 2026.

ALT World Diabetes Day. In 2025, almost 2.9 million Canadian adults reported a diagnosis of diabetes. Chart showcasing the percentage of Canadians aged 18 years and over who reported having been diagnosed with diabetes. Total percentage for those aged 18 years and over: 8.9%. Total for those aged 18 to 34 years: 1.8%; for those aged 35 to 49 years: 5.1%; for those aged 50 to 64 years: 13.0%; and for those aged 65 years and over: 17.7%.

ALT A man looking confused. Top text: Does inflation have you like: Bottom text: We asked our experts questions about the Consumer Price Index and inflation so you don’t have to. Here’s what you need to know.

ALT What is contributing the most to Canada’s inflation? Gasoline prices have been the largest contributor every month since April 2026. In September 2026, the major components that contributed the most to the increase were transportation; shelter; and recreation, education and reading.

ALT Which region in Canada has experienced the greatest inflation in the last year? Map of Canada showing increases in inflation in different regions: +4.7% in Newfoundland and Labrador; +5.7% in Prince Edward Island; +5.6% in Nova Scotia; +5.0% in New Brunswick; +3.1% in Quebec; +2.5% in Ontario; +4.4% in Manitoba; +.3.3% in Saskatchewan; +3.6% in Alberta; +3.0% in British Columbia; +6.1% in Whitehorse, Yukon; +4.7% in Yellowknife, Northwest Territories; +3.0% in Iqaluit, Nunavut.

ALT How does inflation affect me personally? Your personal experience of inflation may not perfectly match the Canadian average because of differences in your spending habits. The Personal Inflation Calculator accounts for these differences and provides a measure of inflation unique to you! To test it out, check out the link in the caption!

ALT Building permits, September 2026. For a detailed description of the visual elements found in this image, see link in caption.

ALT Veterans’ Week. Bar chart titled, “Veterans aged 18 and older reporting a strong sense of belonging to their community, Canada (excluding territories).” Veterans aged 19 to 39 years: 45% men+ and 45% women+. Veterans aged 40 to 59 years: 50% men+ and 49% women+. Veterans aged 60 to 79 years: 65% men+ and 61% women+. Veterans aged 80 years and older: 74% men+ and 72% women+. Note: “Men+” includes men (and boys) and some non-binary persons, and “women+” includes women (and girls) and some non-binary persons.

ALT The Weekly Review, November 2 to 6 2026.

ALT As of 2021, more than 70,000 Inuit lived in Canada. A map shows the distribution of the Inuit population across Canada: Nunavut (44%), Nunavik (18%), the Inuvialuit Settlement Region (4%) and Nunatsiavut (3%). The remaining 31% lived in other parts of Canada.

ALT Labour Force Survey, October 2026. Employment was little changed in October (-4,700; 0.0%). The employment rate fell 0.1 percentage points to 60.5%. The unemployment rate rose 0.2 percentage points to 6.7%.


ALT Canada’s gross domestic product (GDP) increased 1.9% in 2025. GDP rose in Canada (+1.9%), Nunavut (+0.6%), Newfoundland and Labrador (+4.3%), Prince Edward Island (+3.5%), Ontario (+1.8%), Quebec (+1.0%), New Brunswick (+2.4%), Nova Scotia (+3.0%), Manitoba (+1.8%), Saskatchewan (+3.1%), Alberta (+3.3%), British Columbia (+2.4%) and Yukon (+0.7%). The Northwest Territories posted the lone decline (-1.7%).

ALT Canadian international merchandise trade, September 2026. Chart showing the merchandise exports and imports. For a detailed description of the visual elements seen in the chart, see the link in the caption.