
Share, create, and explore @Tableau data visualizations for free on Tableau Public. For more inspiration, view our #VizOfTheDay and connect with our #DataFam ❤️
United States
Joined March 2012
- Tweets6.3K
- Following1.2K
- Followers70.6K
- Likes2.8K






This #VizOfTheDay by Krystyna Ahieieva explores dietary habits and consumption rates in polar bears. See how variables like body mass and meal type shape eating speed.
Explore the viz on Tableau Public: tabsoft.co/4i9zEIY

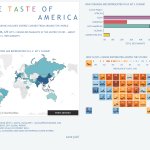
Today's #VizOfTheDay honors Joshua Smith, who won #IronViz 2019 with this visualization contrasting regional restaurant maps against the omission of 148 unrepresented countries.
In doing so, Joshua left behind a true masterclass in empathetic data storytelling.
Explore the viz on Tableau Public: tabsoft.co/4ieTIKc

This #VizOfTheDay by Data Forge Analytics and Engineering presents a service industry dashboard, delivering key insights into revenue performance, operational efficiency, customer satisfaction, and more.
Explore the viz on Tableau Public: tabsoft.co/3VOfAEG

This #VizOfTheDay by Beth Haysom explores the groundbreaking careers and major discoveries of pioneering women in mathematics.
Interactive silhouette selectors and expandable milestone cards make exploring their achievements an engaging journey.
Explore the viz on Tableau Public: tabsoft.co/3W04bS7

This #VizOfTheDay by La'Princia Mance evaluates supply chain efficiency and vendor reliability, tracking on-time delivery rates, lead times, vendor compliance, and fulfillment bottlenecks.
Explore the viz on Tableau Public: tabsoft.co/47ufXXq

This #VizOfTheDay by @jacro28 shows world indicators on a native globe map created with Tableau Agent.
The viz features a dark-mode aesthetic with neon population markers and custom coordinate controls.
Explore the viz on Tableau Public: tabsoft.co/3VTkrUW

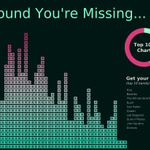
This #VizOfTheDay by @matt_huff_photo explores six decades of music to uncover the chart performance of tracks featuring cowbell.
Discover how many of these songs made the Top 100 while revealing which bands used the instrument most.
Explore the viz on Tableau Public: tabsoft.co/47X3jQS

This #VizOfTheDay by Holly Andersen presents the Finance Dashboard, providing financial health insights, key performance metrics, revenue tracking, and expense trends for corporate decision-making.
Explore the viz on Tableau Public: tabsoft.co/4ykoyXI

This #VizOfTheDay by @dataman_fj explores the rise of satellites and space debris in Earth’s orbit from 1958 through 2026. KPI metrics and historical trendlines break down active spacecraft versus rocket bodies to highlight our increasingly crowded skies.
Explore the viz on Tableau Public: tabsoft.co/4hY0sfm

This #VizOfTheDay by Israel Joseph features a Clinic Performance Dashboard designed to track healthcare metrics like patient status and revenue trends.
Explore the viz on Tableau Public: tabsoft.co/4ykMKcy

This #VizOfTheDay by @trebor_rolyat brings the record-breaking opening weekend of a professional rugby union competition to life with dynamic match-flow timelines.
Track every try-scoring moment and lead shift from kick-off to full time as color-coded steps reveal how each game swung.
Explore the viz on Tableau Public: tabsoft.co/4y9unac

This #VizOfTheDay by @pyonpyon_tab brings demographic data to life with a high-contrast line chart tracking worldwide population growth and decline.
Explore the viz on Tableau Public: tabsoft.co/4APR99H

This #VizOfTheDay by @fred_soh tracks KPI progress and status in a clean, high-level overview, pairing overall targets with progress indicators across metrics like click-through rates, conversion rates, and CSAT to help business leaders monitor key goals at a glance.
Explore the viz on Tableau Public: tabsoft.co/4drzfQI

This #VizOfTheDay by @athnfrnclr tracks the growth of the global population from 3 billion in 1960 to over 8 billion today.
Featuring a radial map layout and dynamic timeline controls, this piece highlights how demographic shares have shifted across nations.
Explore the viz on Tableau Public: tabsoft.co/4rKMW2V

This #VizOfTheDay by Oyedele Samuel features an HR Analytics Dashboard designed to uncover key insights into employee performance, satisfaction, and retention while linking workforce productivity directly to business outcomes.
Explore the viz on Tableau Public: tabsoft.co/4AQvPRx

This #VizOfTheDay by Harry Beardon reimagines personal audio analytics with a dark-mode layout featuring dual "Side A" and "Side B" controls.
Filter through ten years of audio history to see which tracks and artists stayed on repeat.
Explore the viz on Tableau Public: tabsoft.co/4rMekxN

This #VizOfTheDay by Nobu Kimura decodes decades of UFO sighting intelligence using a dark theme with neon green accents.
Uncover temporal heatmaps, peak activity hours, and regional trends in this #MakeoverMonday showcase.
Explore the viz: tabsoft.co/3VpAmKr

Check out this month’s #VizOfTheDay gallery on Tableau Public ➡️ tabsoft.co/47d8zzL
This #VizOfTheDay by Mila Kholodii provides a comprehensive overview of sales performance, breaking down key revenue drivers, order trends, product categories, and regional growth metrics.
Explore the viz on Tableau Public: tabsoft.co/3VXSnzE
