

💪🏼 Upgrade your training with easy to use devices 💵 VBT made affordable $249 📈 Jump testing made simple 👇 Order Now! 👇
Joined July 2023
- Tweets508
- Following23
- Followers2K
- Likes398







Pinned Tweet
Force plate data at a fraction of the cost.
🔹 $1,499
🔹 No subscription
🔹 Built-in display
OVR Force available for pre-order now 🚨
#GamifyYourTraining

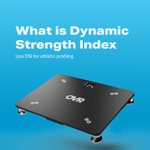
What is Dynamic Strength Index (DSI)? 📊⚡️
Here is how to measure DSI with OVR Force:
1️⃣ Run a CMJ in Jump Mode for propulsive peak force
2️⃣ Run an IMTP in Force Mode for isometric peak force
3️⃣ Divide the results to calculate DSI
#GamifyYourTraining


165


OVR Force is now shipping 📦
All OVR Force pre orders will begin shipping this week. We want to see you using your new force plate, tag @ovrperformance in all your OVR Force content! 📱
Remaining stock is limited.
#GamifyYourTraining

140


OVR Force begins shipping this week 🗓️
The time is finally here, all OVR Force pre orders will begin shipping this week.
#GamifyYourTraining

113


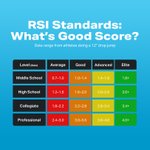
RSI Standards: What's a Good Score? 📊⚡️
Data from male athletes performing a 12" drop jump. Where do your athletes rank? 🏅
👦 Male RSI Benchmarks:
🔴 Middle School (Elite): 1.8+
🟠 High School (Elite): 2.6+
🟡 Collegiate (Elite): 3.4+
🟢 Professional (Elite): 4.0+
Here is what your RSI score actually tells you:
⚡️ High RSI — Height is solid and ground contact time is short. This athlete is reactive, not just powerful. RSI has strong associations with sprint speed and change of direction. It gives coaches a more complete picture of quickness than jump height alone.
💪 Good Height, Lower RSI — The strength is there but the athlete is spending too much time on the ground. Common in strength heavy athletes early in plyometric development. Progressive reactive work like drop jumps, hurdle hops, and bounding tends to bridge the gap.
🎯 High RSI, Modest Height — Efficient mechanics but not enough force production yet. Building the strength base tends to unlock what comes next.
🚨 Height Holds, RSI Drops — The pattern worth watching most closely. When height stays flat but RSI quietly falls ground contact time is creeping up. Research points to this as an early signal of accumulated fatigue before it shows up in output. A good prompt to review training load and recovery.
#GamifyYourTraining

2
292
VBT vs. PBT 📊⚡️
What is the difference, when does each method work, and how do you use both?
❌ The Problem With Percentages
When a coach writes 4x3 at 85% that number is based on a test that happened weeks ago. Sleep, stress, travel, and back to back practices don't move the number on the spreadsheet.
📅 1RM should be tested on one specific day under specific conditions
📉 Day to day fluctuations can shift true capacity by 15-20%
❓ A programmed 85% may actually be 70-90% of that day's real max
📊 Bar speed gives coaches an objective number to work from instead
Here is what bar speed actually tells you:
🔴 Absolute Strength — Less than 0.50 m/s — Greater than 80% 1RM
🟠 Accelerative Strength — 0.50 to 0.75 m/s — 65-80% 1RM
🟡 Strength-Speed — 0.75 to 1.0 m/s — 45-65% 1RM
🟢 Speed-Strength — 1.0 to 1.3 m/s — 25-45% 1RM
🟢 Starting Strength — Greater than 1.3 m/s — Less than 25% 1RM
Stop guessing your training intensity. OVR Velocity puts a number on every rep. 📊
💬 Are you training with VBT or percentages?
#GamifyYourTraining


1
258
How do your athletes stack up? Check out the average jump heights by grade 🎓
Here's why coaches test athlete jump height season after season:
📉 Monitor jump height progress over time
🔢 Track every jump with objective data
👥 Manage every athlete on the roster from a single device
Data taken from 10,000 high school football players.
#GamifyYourTraining

220
10 Yard Dash Benchmarks for Track Athletes by Gender and Level 🏃⚡️
👦 Male Benchmarks:
🔴 Middle School - Average: 1.85–2.05s | Elite: Sub-1.70s
🟠 High School - Average: 1.65–1.80s | Elite: Sub-1.52s
🟡 College - Average: 1.55–1.67s | Elite: Sub-1.52s
🟢 Elite/Olympic - Average: 1.58–1.68s | Elite: Sub-1.45s
👧 Female Benchmarks:
🔴 Middle School - Average: 1.98–2.18s | Elite: Sub-1.80s
🟠 High School - Average: 1.80–1.95s | Elite: Sub-1.65s
🟡 College - Average: 1.68–1.80s | Elite: Sub-1.56s
🟢 Elite/Olympic - Average: 1.72–1.83s | Elite: Sub-1.55s
Sprinters and jumpers produce the fastest 10 yard times in track and field. That same explosive hip extension and rate of force development is exactly what coaches build with depth jump training and other plyometric work.
💬 What is your 10-yard dash time?
#GamifyYourTraining


1
217
How to Quick Delete a Rep ⚡🗑️
1️⃣ Hold down the rep you want to remove from Quick View
2️⃣ Confirm the deletion
3️⃣ Your best and average numbers update instantly so your data stays clean
Track progress using the free OVR Connect app 📱
#GamifyYourTraining


180
Average vs Peak Bar Speed: What Each Number Measures 📈
📏 Average bar speed is the velocity across the whole rep, from the bottom to lockout
⚡ Peak bar speed is the single fastest instant during that same rep, and it's always higher than average
🎯 Use average for strength and hypertrophy work, training off velocity zones, and reading fatigue set to set
🚀 Use peak for explosive lifts like jump squats, bench throws, and Olympic lift variations, where the bar keeps accelerating late in the rep
Near a true 1RM squat, average bar speed sits around 0.30 m/s, and that relationship with load stays close to linear from roughly 30 to 100 percent of 1RM
OVR Velocity tracks both numbers every rep, and the OVR Connect app tracks the data 📊
#GamifyYourTraining


1
283


10 Yard Dash Benchmarks for Basketball Players by Gender and Level 🏃⚡️
Where do you stack up? Here are the 10-yard dash benchmarks from middle school through professional:
👦 Male Benchmarks:
🔴 Middle School - Average: 1.95–2.15s | Elite: Sub-1.77s
🟠 High School - Average: 1.82–1.97s | Elite: Sub-1.66s
🟡 College - Average: 1.73–1.85s | Elite: Sub-1.58s
🟢 Professional - Average: 1.68–1.80s | Elite: Sub-1.53s
👧 Female Benchmarks:
🔴 Middle School - Average: 2.05–2.25s | Elite: Sub-1.87s
🟠 High School - Average: 1.96–2.12s | Elite: Sub-1.79s
🟡 College - Average: 1.87–2.00s | Elite: Sub-1.71s
🟢 Professional — Average: 1.80–1.93s | Elite: Sub-1.64s
First-step quickness is one of the most valued physical qualities in basketball at every level. Know your number, know where you stand, and train to improve it.
💬 What is your 10-yard dash time?
#GamifyYourTraining


185
Vertical Jump Benchmarks for Football Players by Level 🏈⬆️
Where do you're athletes stack up? Here are the vertical jump benchmarks for football players from middle school through professional:
Benchmarks 🏈
🔴 Middle School (Elite): 27 in+
🟠 High School (Elite): 33 in+
🟡 College (Elite): 37 in+
🟢 Professional (Elite): 40 in+
No testing event produces more detailed athletic data than the NFL Combine and vertical jump is one of its most watched measurements. Position creates a wide spread within these ranges. Skill positions like wide receivers and cornerbacks typically test 6 to 10 inches higher than linemen at the same level. A wide receiver and a lineman both sitting at 30 inches in high school are in very different places relative to what their position demands.
Measure and track jump height with OVR Jump 📊
💬 What is your vertical jump height?
#GamifyYourTraining


3
328
Never miss a jump with OVR Jump ⬆️
📺 Built-in display screen
📱 Use with OVR Connect app
📊 Measure daily readiness
⚖️ Compare to previous sessions
#GamifyYourTraining


203
Pro Agility Benchmarks for Football Players by Level 🏈⚡️
Here are the pro agility benchmarks for football players from middle school through professional:
🏈 Football Benchmarks:
🔴 Middle School (Elite): Sub-4.80s
🟠 High School (Elite): Sub-4.30s
🟡 College (Elite): Sub-4.05s
🟢 Professional (Elite): Sub-3.95s
No sport produces more detailed change of direction data than football. The NFL Combine has run the 5-10-5 since the early 2000s and high school football combine databases provide one of the few large sample normative datasets available for this test at the youth level. Skill positions typically produce faster times than linemen at the same level.
💬 What is your pro agility time?
#GamifyYourTraining


278