

Chartered Market Technician (CMT) and Classical chart trader. Ex-Fund manager. 📈 ➡️ https://xitter.gq/t.co/VSwr0eryIS 📺 ➡️ https://xitter.gq/t.co/XFZI3RE8aj
Plovdiv, BULGARIA
Joined May 2011
- Tweets46.2K
- Following452
- Followers191K
- Likes14.2K




Pinned Tweet
Consider TechCharts Membership- Weekly Global Equity Reports, breakout alerts, Educational Video - Classic Charting. blog.techcharts.net/

Aksel Kibar, CMT retweeted

Readers, I post on X separate from my trading business. I don't think of doing a trade and X even within the same minute of mind time.
I love talking and writing about the commodity futures business and being a self-funded career trader to satisfy my desire to write about something I love. I've always been a writer. I graduated in Journalism. I trade for real. I write for the love of talking grandly about futures trading every chance I get.

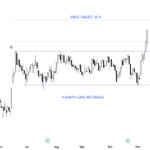
Due to market more #rectangle breakouts ended up being Type 2 and Type 3. It is cyclical and I hope to capture more Type 1 breakouts. #RECTANGLE historically delivered these.


Aksel Kibar, CMT retweeted

It is truly an honor for me to be mentioned alongside Robert Prechter and Hamilton Bolton. Thanks.
Note: none of these breakouts are identified in hindsight. Each and every one of them were first discussed as potential setups and once confirmed were tracked and recorded.
They involve certain amount of subjectivity (my pattern recognition) and selectivity (there can be so many other setups meeting criteria but not considered due to limitations on how many opportunities can be featured).
#TECHCHARTSMEMBERS Breakouts page and chart pattern reliability numbers are updated.
blog.techcharts.net/breakout…

Re-entry can take place with a secondary signal above breakout confirmation level.
Thanks Roy. Good follow up on this.

$FLQM (Franklin U.S. Mid Cap Multifactor Index ETF) update!
Breakout from a 20 month cup and handle, pullback, and resumed higher. Acting as a Type 3 breakout.
What is a Type 3 breakout? Price pulls back deep enough to violate the last full day low, but holds above the pattern negation level, and then buyers regain control.
blog.techcharts.net/2026/07/…


#TECHCHARTSMEMBERS From the latest #watchlist with the potential of a rectangle launching pattern
Access >> tinyurl.com/mwdjpcn8


2,905 on the upside, 2,721 on the downside. Consolidation is better defined. Long or short signal, we will understand soon. $RUT


35
15,321

$DXY A successful breakout should not hesitate here and start rallying. Breakout needs a long white candle out of a possible bull flag.


