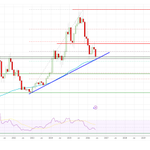
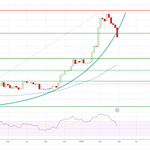
Bitcoin price remained supported above $80,000 against the US Dollar. BTC started a fresh upward move and climbed above $81,200.
Looking at the 4-hour chart, the price was able to surpass the 61.8% Fib retracement level of the downward move from the $84,060 swing high to the $79,644 low. However, BTC faced resistance near a major confluence area of the 100 simple moving average (red, 4-hour) and the 200 simple moving average (green, 4-hour) at $83,000 and the 76.4% Fib level.
The first major resistance might be $83,800. There is also a key bearish trend line formed with resistance at $83,800. A close above $83,800 could start another steady increase. In the stated case, the bulls could aim for a move to $85,000. Any further gain might call for a test of $86,500.
If there is a fresh decline, the pair might find bids near the $80,800 level. The first major support could be $80,000. A downside break and close below $80,000 could trigger a sharp decline. In the stated scenario, the price could test $77,800.
• US Housing Starts for Sep 2026 (MoM) – Forecast 1.310M, versus 1.275M previous.
• US Building Permits for Sep 2026 (MoM) – Forecast 1.40M, versus 1.403M previous.
• US ADP Employment Change 4-week Average - Forecast 18K, versus 24.75K previous.
– The Daily by @AayushJs
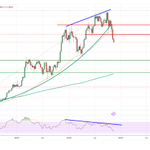
Bitcoin price failed to start a fresh wave above $80,000 against the US Dollar. BTC dipped once again and revisit the key support at $76,350.
Looking at the 4-hour chart, the price formed a base and remained in a range above the $76,000 pivot level but there was a close below the 100 simple moving average (red, 4-hour). On the upside, an immediate resistance could be $78,400.
The first major resistance might be near the 50% Fib retracement level of the downward move from the $82,266 swing high to the $76,024 low at $79,145. A close above the 100 simple moving average (red, 4-hour) and then $79,145 could start another steady increase.
In the stated case, the bulls could aim for a move to $80,800. Any further gain might call for a test of $82,000. If there is a fresh decline, the price could revisit $76,400. The first major support might be $76,000.
A downside break and close below $76,000 could trigger a sharp decline. In the stated scenario, the price could test $74,500 and the 200 simple moving average (green, 4-hour).
• NY Empire State Manufacturing Index for Sep 2026 – Forecast 14.75, versus 20.6 previous.
– The Daily by @AayushJs
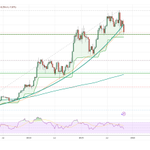
Bitcoin price formed a base above $62,000 and started a fresh rally against the US Dollar but failed. BTC gained pace for a move above hurdles at $66,650 and $70,000.
Looking at the 4-hour chart, the price even settled above $72,000, the 100 simple moving average (red, 4-hour), and the 200 simple moving average (green, 4-hour). It gained over 20% in two days and tested the $75,500 resistance.
A high was formed at $75,716 on TitanFX, and the price is now consolidating. If there is a downside correction, the price might find bids near $73,500.
The first major support might be $72,500. A downside break and close below $72,500 could trigger a sharp decline. In the stated scenario, the price could test $70,500 or even $70,000.
On the upside, an immediate resistance could be $75,500. The first major resistance might be $76,200. The main resistance might be $76,800. A close above $76,800 could send the price toward $78,500. Any further gain might call for a test of $80,000.
• US S&P Global Manufacturing PMI for August 2026 (Preliminary) – Forecast 53.8, versus 53.9 previous.
• US S&P Global Services PMI for August 2026 (Preliminary) – Forecast 54.0, versus 54.6 previous.
– The Daily by @AayushJs
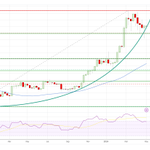
The Euro formed a base above 1.1350 against the US Dollar. EUR/USD started a fresh increase above the 1.1440 and 1.1500 resistance levels.
Looking at the 4-hour chart, the pair gained pace for a move toward 1.1550. There was a close above 1.1500, the 100 simple moving average (red, 4-hour), and the 200 simple moving average (green, 4-hour).
A high was formed at 1.1558, and the pair is now consolidating gains. If there is a downside correction, the pair might find support near 1.1480 or the 38.2% Fib retracement level of the upward move from the 1.1353 swing low to the 1.1558 high.
If there are more losses, the pair could find bids near the 50% Fib retracement level at 1.1455. The main support could be 1.1430 or the 100 simple moving average (red, 4-hour) and the 200 simple moving average (green, 4-hour).
A downside break and close below 1.1430 might send the pair toward 1.1350. Any more losses could open the doors for a test of 1.1300.
On the upside, the pair could face resistance near 1.1550. The next major resistance might be 1.1580. A close above 1.1580 could start another steady increase. In the stated case, the bulls could aim for a move to 1.1620. Any more gains might open the doors for a test of 1.1650.
Upcoming Key Economic Events:
• US ISM Manufacturing Index for July 2026 – Forecast 54.0, versus 53.3 previous.
• US S&P Global Manufacturing PMI for July 2026 – Forecast 53.8, versus 53.8 previous.
☕️ The Daily by @AayushJs
Bitcoin Looks Vulnerable As Downside Risks Continue To Mount
☕️The Daily by @AayushJs
Bitcoin price extended losses and traded below $60,000 against the US Dollar. BTC tested the $58,000 zone and recently started a minor recovery wave.
Looking at the 4-hour chart, the price settled well below $62,000, the 100 simple moving average (red, 4-hour), and the 200 simple moving average (green, 4-hour). The price started a minor recovery wave above the 23.6% Fib retracement level of the downward move from the $65,531 swing high to the $57,996 low.
However, the bears might remain active below the $62,000 pivot level. On the upside, an immediate resistance could be $60,850. The first major resistance might be $61,500.
There is also a bearish flag forming with resistance at $61,500. The main resistance sits near $62,000 and the 50% Fib retracement level. A close above $62,000 could send the price toward $62,800. Any more gain might call for a test of $65,000.
If there is a fresh decline, immediate support might be $59,000. The first key support could be $58,200. The main breakdown support could be $58,000. A downside break below $58,000 might start another decline. The next major support might be $56,500, below which BTC could decline toward $55,000.
Looking at Ethereum, the price started a consolidation phase and could face many hurdles near $1,620 and $1,650.
Ethereum Upside Weakens, Is A Pullback Now Brewing?
☕️The Daily by @AayushJs
Ethereum started a decent increase above the $2,350 resistance. ETH managed to climb above the $2,400 level before the bears appeared.
Looking at the daily chart, the price failed to settle above the 38.2% Fib retracement level of the downward move from the $3,399 swing high to the $1,739 low. It is now correcting some gains and testing the 100-day simple moving average (red).
On the downside, the bulls might be active near $2,250 and $2,220. The main support is now forming near $2,100. There is also a bullish trend line forming with support at $2,100, below which the price could slide toward $1,950. Any more losses might call for a move toward $1,880.
On the upside, the bears might remain active near $2,400. The first key resistance could be near the $2,450 level. The main hurdle for bulls sits near $2,500.
A close above the $2,500 level could open doors for a larger upward movement. In the stated case, ETH could rise toward the 61.8% Fib retracement level of the downward move from the $3,399 swing high to the $1,739 low at $2,765.
Looking at Bitcoin, there was another recovery wave, but the bears remained active below the $80,000 resistance zone.
Bitcoin Edges Higher, Recovery Signals Early Strength
☕️The Daily by @AayushJs
Bitcoin price remained supported above $65,000 against the US Dollar. BTC formed a base and started a recovery wave above $66,500.
Looking at the 4-hour chart, the price surpassed the 23.6% Fib retracement level of the downward move from the $72,001 swing high to the $64,915 low. However, the bears seem to be active near the $68,500 resistance.
There is also a bearish trend line forming with resistance at $68,500. The price is now well below the 100 simple moving average (red, 4-hour) and the 200 simple moving average (green, 4-hour).
Immediate support sits at $67,000. The first key support could be $66,500. The main breakdown support could be near $65,500. A downside break below $65,500 might start another decline. The next major support is $64,200, below which BTC could decline toward $63,500.
On the upside, the price now faces resistance near $68,500 and the trend line. The first key hurdle is $69,200, the 200 simple moving average (green, 4-hour), and the 50% Fib retracement level of the downward move from the $72,001 swing high to the $64,915 low.
A close above $69,200 could send the price toward $71,500. Any more gains might call for a test of $74,000.
Looking at Ethereum, the price also gained bullish momentum above $2,000, and the bulls could now aim for a move toward $2,200.
Bitcoin Breakout Attempt Builds; Bulls Aim for Trend Shift🔀
☕️The Daily by @AayushJs
Bitcoin price remained supported above $68,500 against the US Dollar. BTC climbed above $72,000 and $73,200 to enter a positive zone.
Looking at the 4-hour chart, the price settled above the $72,000 pivot level, the 100 simple moving average (red, 4-hour), and the 200 simple moving average (green, 4-hour). The upward move was such that the price cleared the 1.236 Fib extension level of the downside correction from the $73,926 swing high to the $70,279 low.
It opened the doors for a move above $75,000. On the upside, the price now faces resistance near $76,000 and the 1.618 Fib extension level of the downside correction from the $73,926 swing high to the $70,279 low.
The first key hurdle is $77,000. A close above $77,000 could send the price toward $78,800. Any more gains might call for a test of $80,000.
Immediate support sits at $74,000. The first key support could be $72,500. The main breakdown support could be near a bullish trend line at $71,500. A downside break below the trend line might start another decline. The next major support is $70,000, below which BTC could decline toward $68,500.
Looking at Ethereum, the price also gained bullish momentum above $2,250, and the bulls could now aim for a move toward $2,500.
Ethereum Climbs to Resistance Zone, Breakout Hopes on Trial⚡️
☕️The Daily by @AayushJs
Ethereum started a recovery wave above $3,000. The bulls were able to push ETH above $3,150 and $3,200 before they faced hurdles.
Looking at the daily chart, the price started a decent increase above the 23.6% Fib retracement level of the downward move from the $4,754 swing high to the $2,616 low. The price even surpassed $3,300 before it faced resistance near the 100-day simple moving average (red).
Immediate resistance sits near $3,400. The first key resistance could be near the $3,550 level. The main hurdle for the bulls sits near the 200-day simple moving average (green) at $3,650. The 50% Fib retracement level of the downward move from the $4,754 swing high to the $2,616 low is also near $3,685.
A daily close above the $3,685 resistance zone could start another steady increase. In the stated case, the price may perhaps rise toward the $3,800 level.
On the downside, the bulls might be active near $3,220 and $3,200. The main support is now forming near $3,000, below which the price could slide toward $2,880. Any more losses might call for a move toward $2,620.
Looking at Bitcoin, there was a decent increase, and the bulls were able to push the price above the key resistance at $95,500.
Gold Rewrites Records Above $4,600, CPI Set to Decide Next Move🏆
☕️The Daily by @AayushJs
Gold prices started a fresh rally above $4,450 and $4,500 against the US Dollar. It settled above $4,500 and gained momentum for a new uptrend.
The 4-hour chart of XAU/USD indicates that the price cleared a key contracting triangle with resistance at $4,480. The bulls took control and pushed the price to a new all-time high above $4,610. The price tested the 1.236 Fib extension level of the last downside correction from the $4,549 swing high to the $4,275 low.
On the upside, immediate resistance is near the $4,615 level. The next major resistance sits near the $4,650 level. A clear move above $4,650 could open the doors for more upside. In the stated case, the bulls could aim for a move toward $4,720. It coincides with the 1.618 Fib extension level.
If there is a pullback, Gold might find bids near the $4,550 level. The first major support sits at $4,520, below which the price might slide to $4,500.
The main support sits at $4,480. Any more losses might call for a test of the 100 Simple Moving Average (red, 4 hours) at $4,420 or even the 200 Simple Moving Average (green, 4 hours) at $4,320.
Looking at WTI Crude Oil, the price started a recovery wave, but it continues to face heavy resistance near the $60.00 hurdle.
Aayush Jindal retweeted
Bitcoin Stuck in Struggle, Momentum Remains Unconvincing⛓️
☕️The Daily by @AayushJs
Bitcoin price found support near $85,500 and started a recovery wave against the US Dollar. BTC climbed above $87,500 and $88,000 to enter a short-term positive zone.
Looking at the 4-hour chart, the price even surpassed $90,000 before it faced sellers near $90,550. The price started to decline below $89,000. There was a spike below the 50% Fib retracement level of the recovery wave from the $84,384 swing low to the $90,556 high.
BTC is now trading below a bearish trend line with resistance at $90,000, the 100 simple moving average (red, 4-hour), and the 200 simple moving average (green, 4-hour).
Immediate support sits at $86,800. A downside break below $86,800 might start another decline. The next major support is $85,200. Any more losses might call for an extended decline toward the $83,500 support zone.
If there is another increase, the price could face resistance near the 100 simple moving average (red, 4-hour) at $89,000. The first key hurdle is near the trend line and $90,000.
A successful close above $90,000 might start another steady increase. In the stated case, the price may perhaps rise toward the $92,500 level. Any more gains might call for a test of $94,000.
Looking at Ethereum, the price failed to settle above $3,050 and recently dipped below $3,000 to enter a bearish zone.
Aayush Jindal retweeted
XRP Trades Bearish Below $2.0; Can Bulls Still Fight Back?🧐
☕️The Daily by @AayushJs
XRP price saw a sharp decline from the $2.20 zone. It tumbled below $2.10 and $2.00 before the bulls took a stand.
Looking at the 4-hour chart, the price settled below the $2.00 handle, the 100 simple moving average (red, 4 hours), and the 200 simple moving average (green, 4 hours). It traded as low as $1.8507 on TitanFX and recently started an upside correction.
The price spiked above $1.90 after the US NFP release. There was a test of the 23.6% Fib retracement level of the downward move from the $2.1768 swing high to the $1.8507 low.
On the upside, the price might face resistance near $1.9750 or the 50% Fib retracement level of the downward move from the $2.1768 swing high to the $1.8507 low. The next major resistance is $2.050. The main resistance could be $2.10. There is also a major bearish trend line forming with resistance at $2.080.
A successful close above the $2.10 level might spark a decent increase. In the stated case, the price may perhaps rise toward the $2.20 level. The next stop for the bulls may perhaps be near the $2.320 level.
If there is a fresh decline, the price might find bids near the $1.850 level. The first major support is near the $1.80 level. Any more losses might reverse the recent recovery and push the price toward $1.7250.
Aayush Jindal retweeted
Bitcoin Jumps, Breakout Above Resistance Reinforces Bullish Momentum🌅
☕️The Daily by @AayushJs
Bitcoin price found support near $103,500 and started a fresh increase against the US Dollar. BTC climbed above $108,000 and $110,000 to enter a positive zone.
Looking at the 4-hour chart, the price surpassed the 50% Fib retracement level of the downward move from the $126,279 swing high to the $103,447 low. During the increase, the price broke a key contracting triangle with resistance at $112,900.
BTC settled above $113,000, the 100 simple moving average (red, 4-hour), and the 200 simple moving average (green, 4-hour). If the price extends gains, it could face resistance at $116,500.
The main hurdle is now forming near $117,550 and the 61.8% Fib retracement level of the downward move from the $126,279 swing high to the $103,447 low. A successful close above $117,550 might start another steady increase. In the stated case, the price may perhaps rise toward the $118,800 level. Any more gains might call for a test of $120,000.
Immediate support sits at $112,200. A downside break below $112,200 might start another decline. The next major support is $111,500. Any more losses might call for an extended decline toward the $108,800 support zone.
Looking at Ethereum, the price was able to follow Bitcoin and climbed above the $4,000 resistance region.
Aayush Jindal retweeted
Bitcoin Retreats; Market Fears More Pain If Key Level Fails😱
☕️The Daily by @AayushJs
Bitcoin price failed to extend gains above $118,000 against the US Dollar. BTC reacted to the downside and traded below the $115,000 support.
Looking at the 4-hour chart, the price declined sharply below a major bullish trend line with support at $115,800. There was a clear move below the 50% Fib retracement level of the upward move from the $107,234 swing low to the $117,933 high.
The pair settled below the 100 simple moving average (red, 4-hour) and spiked below the 200 simple moving average (green, 4-hour). Immediate support is $112,000. A downside break below $112,000 might send BTC toward the $110,000 support. Any more losses might send the price toward the $107,500 support zone.
On the upside, the price now faces resistance near the $113,800 level. The main hurdle is now forming near $115,000 and the 100 simple moving average (red, 4-hour).
A successful close above $115,000 might start another steady increase. In the stated case, the price may perhaps rise toward the $116,500 level. Any more gains might call for a test of $118,000.
Looking at Ethereum, the price reacted to the downside below $4,200 and might extend losses toward the $3,880 support.
Aayush Jindal retweeted
USD/JPY Faces Uphill Task After Recent Bullish Attempt Fades🧗♀️
☕️The Daily by @AayushJs
The US Dollar attempted a fresh increase above 147.50 against the Japanese Yen. USD/JPY failed to settle above 148.00 and trimmed most gains.
Looking at the 4-hour chart, the pair traded below the 50% Fib retracement level of the upward move from the 146.57 swing low to the 148.18 high. The pair even settled below the 100 simple moving average (red, 4-hour) and the 200 simple moving average (green, 4-hour).
The current price action is bearish below the 61.8% Fib retracement level. On the downside, immediate support is 146.60. The next key support sits at 146.20. Any more losses could send the pair toward the 145.50 support zone.
On the upside, the pair now faces resistance near 147.60. The next key resistance sits at 147.80. There is also a key bearish trend line forming with resistance at 147.80 on the same chart. A close above 147.80 and 148.00 could set the pace for another increase.
In the stated case, the pair could rise toward 148.80, above which the bulls could aim for a move toward 149.20. Any more upsides could send USD/JPY toward 150.00.
Looking at EUR/USD, the pair started a fresh increase, but the bears might again attempt to prevent gains above 1.1720.
Aayush Jindal retweeted
Bitcoin Correction Worsens, Is a Bigger Drop Now on Horizon?🔮
☕️The Daily by @AayushJs
Bitcoin price started a downside correction below $112,500 against the US Dollar. BTC even declined below $110,000 before the bulls appeared.
Looking at the 4-hour chart, the price tested the $108,650 zone and is currently consolidating losses. If there is a recovery wave, the price could face resistance near $112,000 and the 38.2% Fib retracement level of the downward move from the $117,407 swing high to the $108,637 low.
The next key resistance is $114,000 or the 61.8% Fib retracement. The main hurdle is now forming near a bearish trend line at $115,500 on the same chart. It coincides with the 100 simple moving average (red, 4-hour) and the 200 simple moving average (green, 4-hour).
A successful close above $115,500 might start another steady increase. In the stated case, the price may perhaps rise toward the $118,000 level. Any more gains might call for a test of $120,000.
Immediate support is $108,500. A downside break below $108,500 might send BTC toward the $106,500 support. Any more losses might send the price toward the $103,200 support zone.
Looking at Ethereum, the price traded to a new all-time high close to $5,000, and it is now consolidating gains above $4,250.
Aayush Jindal retweeted
#XAUUSD at a Pivotal Level – Can Momentum Flip Higher Now?🏆
☕️The Daily by @AayushJs
Gold prices failed to settle above $3,400 and corrected gains against the US Dollar. It declined below the $3,375 and $3,360 support levels.
The 4-hour chart of XAU/USD indicates that the price settled below the $3,350 level, the 100 Simple Moving Average (red, 4 hours), and the 200 Simple Moving Average (green, 4 hours). There was a move below the 50% Fib retracement level of the upward move from the $3,268 swing low to the $3,408 high.
On the downside, initial support is near the $3,320 level. It is close to the 61.8% Fib retracement level of the upward move from the $3,268 swing low to the $3,408 high.
The first key support is $3,310. The next major support is near the $3,300 level. A downside break below $3,300 might call for more downsides. The next key zone to watch could be $3,280.
On the upside, immediate resistance is near the $3,345 level. There is also a major bearish trend line forming with resistance at $3,345 on the same chart. The next major resistance sits near the $3,355 level.
A clear move above $3,355 could open the doors for more upside. In the stated case, the bulls could aim for a move toward $3,400, above which the price could rally toward the milestone level of $3,450.
Looking at WTI Crude Oil, the price shows many bearish signs and could decline further below the $62.00 support zone.
Aayush Jindal retweeted
Ethereum Cools After Rally, But Bulls Eye $4K in Post-Pullback Surge👀
☕️The Daily by @AayushJs
Ethereum started a major increase above the $2,650 and $2,800 resistance levels. ETH cleared the $3,000 barrier and rallied above $3,500 before facing hurdles.
Looking at the daily chart, the price settled above the $3,500 level and the 100-day simple moving average (red). A high was formed at $3,856 and the price is now consolidating gains. On the downside, Ethereum might find support near the $3,500 level.
The next major support is $3,450 or the 23.6% Fib retracement level of the upward move from the $2,108 swing low to the $3,856 high, below which the price could slide toward $3,200.
There is also a connecting bullish trend line forming with support at $3,150 on the same chart. Any more losses might call for a move toward the $3,000 level or the 50% Fib retracement level of the upward move from the $2,108 swing low to the $3,856 high.
On the upside, the price is facing hurdles near the $3,800 level. The next major resistance is near the $3,850 level. A daily close above the $3,850 resistance zone could start another steady increase. In the stated case, the price may perhaps rise toward the $4,000 level. The next stop for the bulls may perhaps be $4,200.
Looking at Bitcoin, there was a steady increase above the $118,000 level but the bulls struggled to keep the price above the $120,500 level.
Aayush Jindal retweeted
$WTI at Risk, More Downside Could Be Coming😬
☕️The Daily by @AayushJs
Crude Oil prices started a fresh decline below the $70.00 zone. A rising channel is forming with support at $66.50 on the 4-hour chart.
Full story🔗titanfx.com/news/wti-crude-o…
Aayush Jindal retweeted
$USDCAD Gears Up, Bullish Momentum Could Take Over Soon🚀
☕️The Daily by @AayushJs
· USD/CAD started a fresh increase above the 1.3650 resistance. It cleared a key bearish trend line with resistance at 1.3675 on the 4-hour chart.
· EUR/USD is slowly moving lower and might test the 1.1650 zone.
· GBP/USD is struggling to restart gains above the 1.3650 level.