

Microcap investor | Swing trader | Focused on asymmetric opportunities backed by research & risk control | MSc Topper 🎓 | Not SEBI registered | No recos
Alpha Circle 👉🏻
Joined March 2025
- Tweets11.2K
- Following496
- Followers15.7K
- Likes13.9K






Akash Chaudhary retweeted

📊 Sector Performance & Key Nifty 500 Stock Returns: Samvat to Samvat (2082)
During Samvat 2082, 287 out of 570+ / Nifty 500 constituents declined, while select sector leaders posted strong outperformance.
🟩 Top Performing Sectors & Key Stock Highlights
▪️ Pharma & Healthcare (+26.26% / +14.27%)
Sun Pharma, Cipla, Dr. Reddy's, Global Health (Medanta), Apollo Hospitals
▪️ Metals (+24.34%)
Tata Steel, Hindalco, JSW Steel, Vedanta
▪️ Media (+10.22%)
Sun TV Network, Zee Entertainment
▪️ PSU Banks & Banking (+9.32% / +3.39%)
State Bank of India (SBI), Bank of Baroda, Punjab National Bank, ICICI Bank
▪️ Commodities & Energy (+4.95% / +3.87%)
Reliance Industries, NTPC, ONGC, Coal India
▪️ Automobiles (+2.25%)
Mahindra & Mahindra, Maruti Suzuki, Tata Motors, Bajaj Auto
🟧 Lagging Sectors & Key Stock Highlights
▪️ Infrastructure (-0.26%)
Larsen & Toubro, IRB Infrastructure
▪️ Financial Services (-1.29%)
Bajaj Finance, Shriram Finance, Bajaj Finserv
▪️ Consumer Durables (-2.89%)
Havells, Voltas, Crompton, Blue Star
▪️ Oil & Gas (-3.09%)
BPCL, HPCL, IOC
▪️ Realty (-4.97%)
DLF, Godrej Properties, Macrotech Developers (Lodha)
▪️ India Consumption (-5.62%)
Titan Company, Trent, Avenue Supermarts (DMart)
▪️ IT (-6.88%)
TCS, Infosys, Wipro, HCLTech, Tech Mahindra
▪️ FMCG (-17.45%)
Hindustan Unilever (HUL), ITC, Nestle India, Britannia Industries, Dabur
Source: NSE, BSE, Capital Market (Data as of 08/11/26)
ℹ️ For educational purposes only. Not a recommendation. DYODD.

Akash Chaudhary retweeted
🏥 Which Hospitals Are Growing Fastest? (By PAT Growth)
Here is the Q2 FY27 PAT growth breakdown across leading hospital chains:
▪️ Global Health (Medanta): 38.3%
▪️ Aster DM Quality Care: 34.0%
▪️ Apollo Hospitals: 32.0%
▪️ Yatharth Hospital: 17.0%
▪️ Rainbow Children's: 10.9%
▪️ Narayana Hrudayalaya: 10.6%
▪️ Max Healthcare: 10.0%
Source: GCR Research
ℹ️ For educational purposes only. Not a recommendation. DYODD.

Akash Chaudhary retweeted
❄️ Air Purifier Stocks in India (By Market Cap)
Breakdown of major players in the air purifier space 👇🏻
▪️ LG: ₹1,21,758.19 Cr
▪️ Havells: ₹72,765.77 Cr
▪️ Voltas: ₹36,069.75 Cr
▪️ Blue Star: ₹32,435.73 Cr
▪️ Crompton: ₹14,095.30 Cr
▪️ Eureka Forbes: ₹7,202.90 Cr
▪️ Hindware: ₹1,451.68 Cr
Data as of 09 Nov 2026 | Source: NSE India
ℹ️ For educational purposes only. Not a recommendation. DYODD.


ICICI PRUDENTIAL LARGE & MID CAP FUND – OCTOBER 2026 PORTFOLIO DISCLOSURE 🚀
The complete portfolio holdings, stock-wise allocation, quantity, market value and percentage of NAV are provided in the attached image below 👇
▪️ A detailed look at the fund's latest portfolio composition, major stock holdings and sectoral exposure.
▪️ Useful for tracking which companies and sectors a leading mutual fund is allocating capital to.
Disclaimer: Shared for educational and informational purposes only.


MOTILAL OSWAL MIDCAP FUND – OCTOBER 2026 PORTFOLIO DISCLOSURE 🔥
The complete portfolio holdings, stock-wise allocation, quantity, market value and percentage of AUM are provided in the attached image 👇
Disclaimer: Shared for educational and informational purposes only. This is not an investment recommendation.


ABAKKUS SMALL CAP FUND – OCTOBER 2026 PORTFOLIO DISCLOSURE 🔥
The complete portfolio holdings, stock-wise allocation, quantity, market value and percentage of AUM are provided in the attached images 👇
▪️ A detailed look at the fund's latest small-cap portfolio allocation and stock holdings.
Disclaimer: Shared for educational and informational purposes only. This is not an investment recommendation.


2026 IPO COMPANIES SHOWING GOOD STRENGTH AND FUNDAMENTALS – STUDY & TRACK
▪️ Bonfiglioli Transmissions
▪️ Zetwerk Manufacturing
▪️ Indo-MIM
▪️ Aye Finance
▪️ Karamtara Engineering
▪️ Tonbo Imaging
▪️ EAAA India Alternatives
▪️ Dhoot Transmission
▪️ Steamhouse
▪️ Sonaselection
▪️ Sedemac Mechatronics
▪️ NSE
▪️ Rentomojo
▪️ Waterways Leisure
▪️ Prasol Chemicals
▪️ Xtranet Technologies
▪️ Symbiotec Pharmalab
▪️ Lalithaa Jewellery
▪️ Sahajanand Medical Technologies
These companies are worth keeping on the radar for further research and tracking. Focus on their business models, financial performance, growth prospects, competitive advantages, management quality and valuations.
Disclaimer: This list is for educational purposes only and is not a buy or sell recommendation.
HIGH RELATIVE STRENGTH STOCKS TO STUDY & TRACK 🔥🔥🔥
Laurus Labs
Lenskart Solutions
Coforge
MCX
Ather Energy
Sona BLW Precision
Gland Pharma
Cupid
Sai Life Sciences
Acutaas Chemicals
Sansera Engineering
Welspun Living
Diamond Power
Shadowfax Technologies
Lumax Auto Technologies
Shreeji Shipping Global
Pearl Global Industries
Saregama India
Sri Lotus Developers
SG Mart
Indo Count Industries
M B Agro Products
Unimech Aerospace
Steel Strips Wheels
Entero Healthcare
Neogen Chemicals
Krishna Phoschem
Tourism Finance Corporation of India
Timex Group India
Rolex Rings
Sambhv Steel Tubes
SG Finserve
Nitin Spinners
Yash Highvoltage
Shukra Pharmaceuticals
SBC Exports
Oriental Hotels
Ratnaveer Precision Engineering
M M Forgings
⚪ WHY TRACK RELATIVE STRENGTH?
Relative strength helps identify stocks outperforming the broader market or their respective indices.
▪️ Strong stocks tend to show resilience during market corrections.
▪️ They can attract buying interest when broader market momentum improves.
▪️ Look for sustained outperformance, strong price structures, volume confirmation and healthy consolidations.
▪️ Relative strength is a useful starting point for identifying potential leaders, but fundamental research and risk management remain equally important.
Disclaimer: This is a watchlist for educational and research purposes only. Inclusion does not imply a buy recommendation.

Akash Chaudhary retweeted

PNGS Reva Diamond Jewellery Q2FY27 Concall Updates -
PNGS Reva delivered a strong performance despite an unfavourable festive calendar.
Q2FY27:
=> Revenue growth (excluding gold sales): 46%
=> Gross Profit: Rs. 37 CR;+50%
=> EBITDA: Rs. 29 CR; +49%
=> PAT: Rs. 23 CR; +84%
H1FY27:
=> Revenue (excluding gold sales): Rs. 239 CR; +76%
=> Gross Profit: Rs. 79 CR; +90%
=> EBITDA: Rs. 63 CR; +103%
=> PAT: Rs. 51 CR; +151%
The business is witnessing strong demand along with significant margin expansion.
Major Growth Drivers
▶️Volume Growth
Management highlighted a gradual shift in consumer preference from plain gold jewellery towards natural diamond-studded gold jewellery.
=> Q2 revenue growth excluding gold sales: 46%.
=> Diamond stone sales volume growth: ~28%.
=> Gold value growth: ~57%.
=> Approximately 20% of gold value growth came from price appreciation.
▶️Average Selling Price and Better Product Mix
Average invoice value increased to approximately Rs. 1.05–1.07 lakh, compared with around Rs. 92,000 in the previous year.
Management attributed growth partly to better availability of fast-moving price points. The company is catering to multiple customer segments:
=> Entry-level: Rs. 15,000–35,000
=> Everyday jewellery: Rs. 35,000–1.5 lakh
=> Occasion jewellery: Rs. 1.5–5 lakh
=> Premium/signature: Rs. 5–25 lakh+
The higher average invoice value indicates an improvement in customer spending and/or product mix.
▶️Gold price appreciation
Management indicated that gold value growth was approximately 57%, with around 20% of the increase attributable to gold price appreciation.
👉Higher jewellery volumes and customer demand
👉Higher gold value embedded in the jewellery sold.
▶️Existing SIS network is driving growth & Beyond
The current business model is heavily dependent on SIS counters inside P. N. Gadgil stores.
More than 95% of revenue currently comes from SIS.
Management expects SIS same-store growth of approximately 35–40%.
These counters benefit from existing store footfall, established customer relationships and lower incremental infrastructure requirements.
Reva is expanding beyond its traditional SIS distribution network. During FY27, it launched stores at:
=> Amanora Mall, Pune
=> Nashik
=> Jaipur – its first store outside Maharashtra
=> Bavdhan, Pune
The company has an existing plan to establish 15 new exclusive outlets over 24 months, with four already added.
Management also indicated an ambition of 50 EBOs over the next 7–8 years.
Store Economics: Important Management Commentary
Management provided useful details about store-level economics.
Inventory requirement:
=> 1,000 sq. ft.: Rs. 10–12 CR
=> 1,200 sq. ft.: Rs. 12–15 CR
=> 1,500 sq. ft.: Rs. 15–18 CR
Infrastructure and initial marketing investment: approximately Rs. 2–2.5 CR
Store maturity:
- Initial 15–18 months: Establishing the store.
- Initial stock-turn target: 0.75%.
- Mature annual sales expectation: Rs. 9–10 CR.
- Longer-term stock-turn target: 1.25% within 3–4 years from the initial ramp-up period.
Wakad store has already achieved Rs. 6.5 CR sales during its first September-to-September year.
Management expects meaningful profitability contribution from the new EBO cohort around Q4FY28 onwards.
Margins: Can the Current Performance Continue
H1FY27 EBITDA margin expanded to 26.3% from 19.6%. Q2FY27 EBITDA margin reached 23.8%, compared with 18.7% in Q2FY26
However, management cautioned that new EBOs will bring additional:
• Marketing expenditure.
• Employee costs.
• Rental expenses.
• Initial operating expenses.
Management indicated potential EBITDA margin fluctuations of approximately 200 bps, plus or minus.
Therefore, investors should not automatically extrapolate H1 margins into the future.
FY27 Outlook: Management Remains Cautiously Optimistic
Management expects continued growth in H2, supported by the festive and wedding season. Though highlighted challenges, which can be hurdle -
• Gudi Padwa will not fall in H2FY27. Management indicated that it contributes approximately 10% of annual sales in Maharashtra.
• More than 85% of Maharashtra was under drought conditions.
• Inflationary pressures could affect discretionary consumption.
• Gold-price appreciation is unlikely to provide meaningful inventory gains in H2.
Management indicated a more cautious growth expectation of around 40–45% in the H2 discussion.
Bottom Line
The real test will be whether the company can scale its retail network while maintaining healthy margins, inventory productivity and cash-flow discipline.
SIS is driving today's growth, while EBO expansion could create the next leg of growth.
PNGS Reva is building a branded natural diamond jewellery business at a time when Indian consumers are increasingly exploring diamond-studded jewellery.
🟥Disclaimer: Invested. This post is for educational and study purposes only. Please do not consider it as a Buy/Sell recommendations.


Akash Chaudhary retweeted
❄️ Stocks behind your frozen food ecosystem
▪️ Frozen Snacks & Meals: Godrej Industries (₹960.0), ADF Foods (₹240.9), Vadilal Industries (₹7,060)
▪️ Frozen Chicken: Venky's / VHL (₹1,594), Godrej Industries (₹960.0), Westlife Foodworld (₹657.7)
▪️ Frozen Fruits & Vegetables: Foods & Inns (₹43.7), Tarai Foods (₹4.15), Tanvi Foods (₹61.37)
▪️ Ice Cream & Desserts: Vadilal Industries (₹7,060), Heritage Foods (₹373.90), Hatsun Agro Product / HAP (₹1,069.50)
▪️ Cold Storage & Transport: Snowman Logistics (₹34.00), Gateway Distriparks (₹46.97), Transport Corporation of India / TCI (₹861.00)
▪️ Commercial Refrigeration: Blue Star (₹1,575), Voltas (₹1,099), Amber Enterprises (₹6,403)
▪️ Packaging: UFlex (₹574.5), Huhtamaki (₹212.8), Mold-Tek Packaging (₹340)
(Source: Google Finance | Data as of 6th Nov, 2026)
ℹ️ For educational purposes only. Not a recommendation. DYODD.

ALL 87 SME COMPANIES REPORTING STRONG SALES GROWTH IN H1 FY27 / Q2 FY27 TO STUDY🔥🔥🔥
The increase in sales growth (YoY) reported by these companies is mentioned below:
▪️ Kesar India – 554%
▪️ Gretex Industries – 503%
▪️ Vans Electroengineerings – 308%
▪️ Anawil Wire – 272%
▪️ Aptus Pharma – 240%
▪️ GRE Renew – 223%
▪️ Blue Water – 211%
▪️ Teamtech Formwork – 199%
▪️ Mach Travel Solutions – 182%
▪️ Bizotic Commercial – 172%
▪️ Sheetal Universal – 160%
▪️ B-Right Real – 159%
▪️ Prizor Viztech – 154%
▪️ Organic Recycling – 152%
▪️ Akiko – 138%
▪️ Innomet Advanced – 137%
▪️ Bai-Kakaji Polymers – 124%
▪️ Simca Advertis. – 124%
▪️ ACE Alpha Tech – 121%
▪️ Madhusudan Masa – 118%
▪️ Prime Cable Industries – 117%
▪️ TechD Cybersecurity – 114%
▪️ Savy Infra – 113%
▪️ Infinity Infoway – 106%
▪️ Purple United – 104%
▪️ Sathlokhar Systems – 100%
▪️ Chemkart India – 99%
▪️ Goldstar Power – 99%
▪️ Technocrats Plasma Systems – 97%
▪️ Kody Technolab – 97%
▪️ OBSC Perfection – 97%
▪️ Yash Highvoltage – 95%
▪️ Concord Control – 95%
▪️ GP Eco Solutions – 93%
▪️ Indo SMC – 92%
▪️ Chaman Metallics – 92%
▪️ Hoac Foods – 91%
▪️ Shivam Chemicals – 91%
▪️ Shreedhar Spinners – 90%
▪️ Monolithisch India – 88%
▪️ Cospower Engineering – 87%
▪️ HP Telecom – 85%
▪️ Shree Refrigerations – 85%
▪️ Aimtron Electronics – 83%
▪️ Utssav CZ Gold – 83%
▪️ Digilogic Systems – 83%
▪️ Fabtech Technologies Cleanrooms – 75%
▪️ Sunlite Recycling – 75%
▪️ Taurian MPS – 73%
▪️ Sugs Lloyd – 73%
▪️ V-Marc India – 73%
▪️ Jay Jalaram Tech – 69%
▪️ Parmeshwar Metal – 69%
▪️ Poojaa Precision Engineering – 68%
▪️ Laxmipati Engineering – 68%
▪️ B.R. Goyal Infra – 62%
▪️ Gayatri Rubbers – 59%
▪️ Forcas Studio – 56%
▪️ Aayush Art – 56%
▪️ Apsis Aerocom – 55%
▪️ Infinium Pharma – 54%
▪️ Connplex Cinemas – 54%
▪️ Msafe Equipments – 54%
▪️ Remus Pharma – 53%
▪️ Credent Connect N Care – 53%
▪️ Silkflex Polymer – 52%
▪️ Trident Lifeline – 50%
▪️ Unified Data – 50%
▪️ Admach Systems – 48%
▪️ Spunweb Nonwoven – 48%
▪️ Adisoft Technologies – 48%
▪️ Rajesh Power – 46%
▪️ Goel Construction – 45%
▪️ Effwa Infra – 45%
▪️ Macfos – 44%
▪️ Cryogenic OGS – 44%
▪️ Hi-Green Carbon – 43%
▪️ Parth Electrical – 42%
▪️ Danish Power – 38%
▪️ Patil Automation – 37%
▪️ Novus Loyalty – 37%
▪️ Monarch Survey – 36%
▪️ Brandman Retail – 35%
▪️ Shri Ahimsa – 32%
▪️ Petro Carbon – 32%
▪️ Vivid Electromech – 30%
Strong sales growth is worth tracking, but growth alone is not enough. Check profitability, cash flows, debt and valuations before making an investment decision.
📌 Once all companies have announced their results, I will upload the updated list covering all the results of this earnings season and then close the list.
Which companies from this list are on your watchlist?
Disclaimer: For educational purposes only. Not a buy or sell recommendation. Please do your own research (DYOR) before making any investment decisions. DYDD.

ABAKKUS SMALL CAP FUND – OCTOBER 2026 PORTFOLIO DISCLOSURE 🔥
The complete portfolio holdings, stock-wise allocation, quantity, market value and percentage of AUM are provided in the attached images 👇
▪️ A detailed look at the fund's latest small-cap portfolio allocation and stock holdings.
Disclaimer: Shared for educational and informational purposes only. This is not an investment recommendation.
HELIOS SMALL CAP FUND – OCTOBER 2026 PORTFOLIO DISCLOSURE
The complete portfolio holdings, stock-wise allocation, quantity, market value and percentage of AUM are provided in the attached images 👇
Disclaimer: Shared for educational and informational purposes only. This is not an investment recommendation. Please conduct your own research before making any investment decisions.


Akash Chaudhary retweeted
BlueStone Jewellery Q3FY27 Numbers
Company posted a 45% growth in Q3 which includes the festive period.
Driven by largely buyer transaction with average realisation being the same.
👉Strong festive performance indicates improving traction for its design-led jewellery proposition.

Akash Chaudhary retweeted
CDSL Q2FY27 Concall Updates -
With 19.34 crore demat accounts, expanding digital financial infrastructure and multiple revenue streams, it is strategically positioned to benefit from India's growing capital markets.
🔶Business Model -
CDSL is one of India's two securities depositories, alongside NSDL.
Think of CDSL as a digital bank locker for shares, bonds, ETFs and other securities.
When an investor purchases shares through a broker, the securities are held electronically in a demat account.
CDSL maintains the underlying ownership records and facilitates securities transfers, pledging and other depository services.
Its business model has multiple revenue streams:
🔸Annual issuer income - recurring revenue - fees from companies and securities issuers
🔸IPO and corporate action income – market-linked revenue - IPO applications, bonus issues, rights issues, stock splits, etc.
🔸Transaction charges - securities transfer and debit-related activity
🔸Online data charges - KYC record creation and fetching through its subsidiary CDSL Ventures (CVL).
🔸Margin pledge and e-services - e-Voting, e-CAS, margin pledge and digital services
🔸Investment and other income
Revenue Mix -
=> Annual issuer income: Rs. 129 CR
=> IPO/Corporate action income: Rs. 102 CR
=> Online data charges: Rs. 68 CR
=> Transaction charges: Rs. 54 CR
=> Investment income: Rs. 21 CR
=> Other income: Rs. 43 CR
Annual issuer income remains the largest individual component. IPO and corporate action income contributed approximately 24.5% of total income.
Demat account growth – a structural opportunity
CDSL's operating metrics continue to expand.
=> Demat accounts: 19.34 crore vs 16.51 crore YOY.
=> New accounts opened in Q2FY27: 75 lakh.
=>Demat custody: Rs. 89 lakh CR vs Rs. 80 lakh CR.
=> Number of issuers: 51,132 vs 44,011.
=> Number of ISINs: 1,39,495 vs 1,13,909
Management highlighted that CDSL accounts for more than 80% of the industry's demat accounts.
More investors, securities and issuers expand the ecosystem in which CDSL operates.
🔶Management commentary – important concall insights
🔸IPO & Corporate Action – a major growth contributor
IPO and corporate action income reached approximately Rs. 102 CR in Q2FY27 against Rs. 44 CR in Q1FY27.
Management highlighted IPO proceeds exceeded Rs. 86,500 CR during July–September 2026. September witnessed approximately 34 IPOs.
👉It was the highest number of IPOs in a single month since December 1996.
🔸Online data pricing reduction – volumes are compensating
CDSL Ventures (CVL) operates the KYC Registration Agency business. It earns revenue from online KYC record creation and fetching.
Effective April 1, 2026, pricing was revised:
Record creation: Rs. 20 to Rs. 5 (75% reduction).
Record fetching: Rs. 35 to Rs. 28 (20% reduction).
Management stated that higher record creation and fetching volumes have substantially compensated for the pricing impact.
🔸Technology investments
Management clarified that technology investments are not completely behind the company.
Investments will continue wherever required to improve efficiency, resilience and customer experience.
Management specifically highlighted that the infrastructure handled the record IPO activity smoothly.
🔸KRA Business
Management highlighted several developments:
=> Search API revenue declined sequentially after becoming chargeable.
=> Intermediaries fine-tuned their systems, resulting in fewer transactions.
=> Interoperability expenses increased with higher fetching volumes.
=> UIDAI-related expenses increased due to higher eSign and Aadhaar eKYC activity.
=> Aadhaar-based eKYC services through sub-KUAs have started contributing additional income.
The company also disclosed that the revised Rs. 5 and Rs. 28 rates are rack rates, not blended realisations.
🔸New growth opportunities
=> Demat 2.0 – Tokenised corporate bonds
=> Investor App - Consolidated view of securities across both depositories and monitoring of open and margin positions
=> Loan Against Securities (LAS)
=> DigiLocker integration
=> Account Aggregator
=> Digital TDS declaration
👉These initiatives strengthen the value proposition of CDSL and can create additional monetisation opportunities over tim
🔸Unlisted securities – an opportunity to watch
Management said the matter is going through regulatory supervision and is still in process.
The opportunity is worth monitoring because a wider unlisted securities ecosystem could potentially expand issuer-related revenue.
👉If permitted and implemented, this could potentially expand the issuer and securities ecosystem.
🔸Margin pledge revenue and MTF growth
Management disclosed Q2FY27 margin pledge revenue of Rs. 6.19 CR.
👉An analyst questioned why pledge revenue was not growing proportionately with the MTF book
Management clarified that there is no one-to-one correlation between MTF book growth and CDSL's pledge income.
This is important: investors should not directly extrapolate broker MTF growth into CDSL revenue growth.
🔶Risk to Monitor
=> IPO slowdown can affect IPO and corporate action income.
=> KRA pricing pressure can impact online data realisations.
=> CVL's rising expenditure needs to translate into better profitability.
=> Technology investments will remain necessary.
=> Regulatory changes can affect pricing and business opportunities.
=> New businesses such as insurance and commodity repositories need better monetisation.
👉The biggest question is how consistently CDSL can grow earnings when IPO activity normalises.
Bottom Line
As more investors enter the market, more companies issue securities and more financial assets move into digital ownership, CDSL's infrastructure becomes increasingly important.
Q2FY27 demonstrates that the company can monetise strong market activity while maintaining high profitability.
However, the next leg of growth will depend on how well it converts its expanding ecosystem into sustainable recurring revenue and subsidiary profitability.
🟥Disclaimer: Invested. This post is for educational and study purposes only. Please do not consider it as a Buy/Sell recommendations.


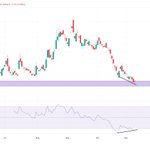
Susan Electricals India
It has come back to the major support zone + RSI divergence signalling short term reversal may come in.
Profit booking is extremely important. Hold it for longer term when actual bull market hits the floor.
In choppy / sideways market - gains will keep vanishing if not taken at the right time.
No recommendations.

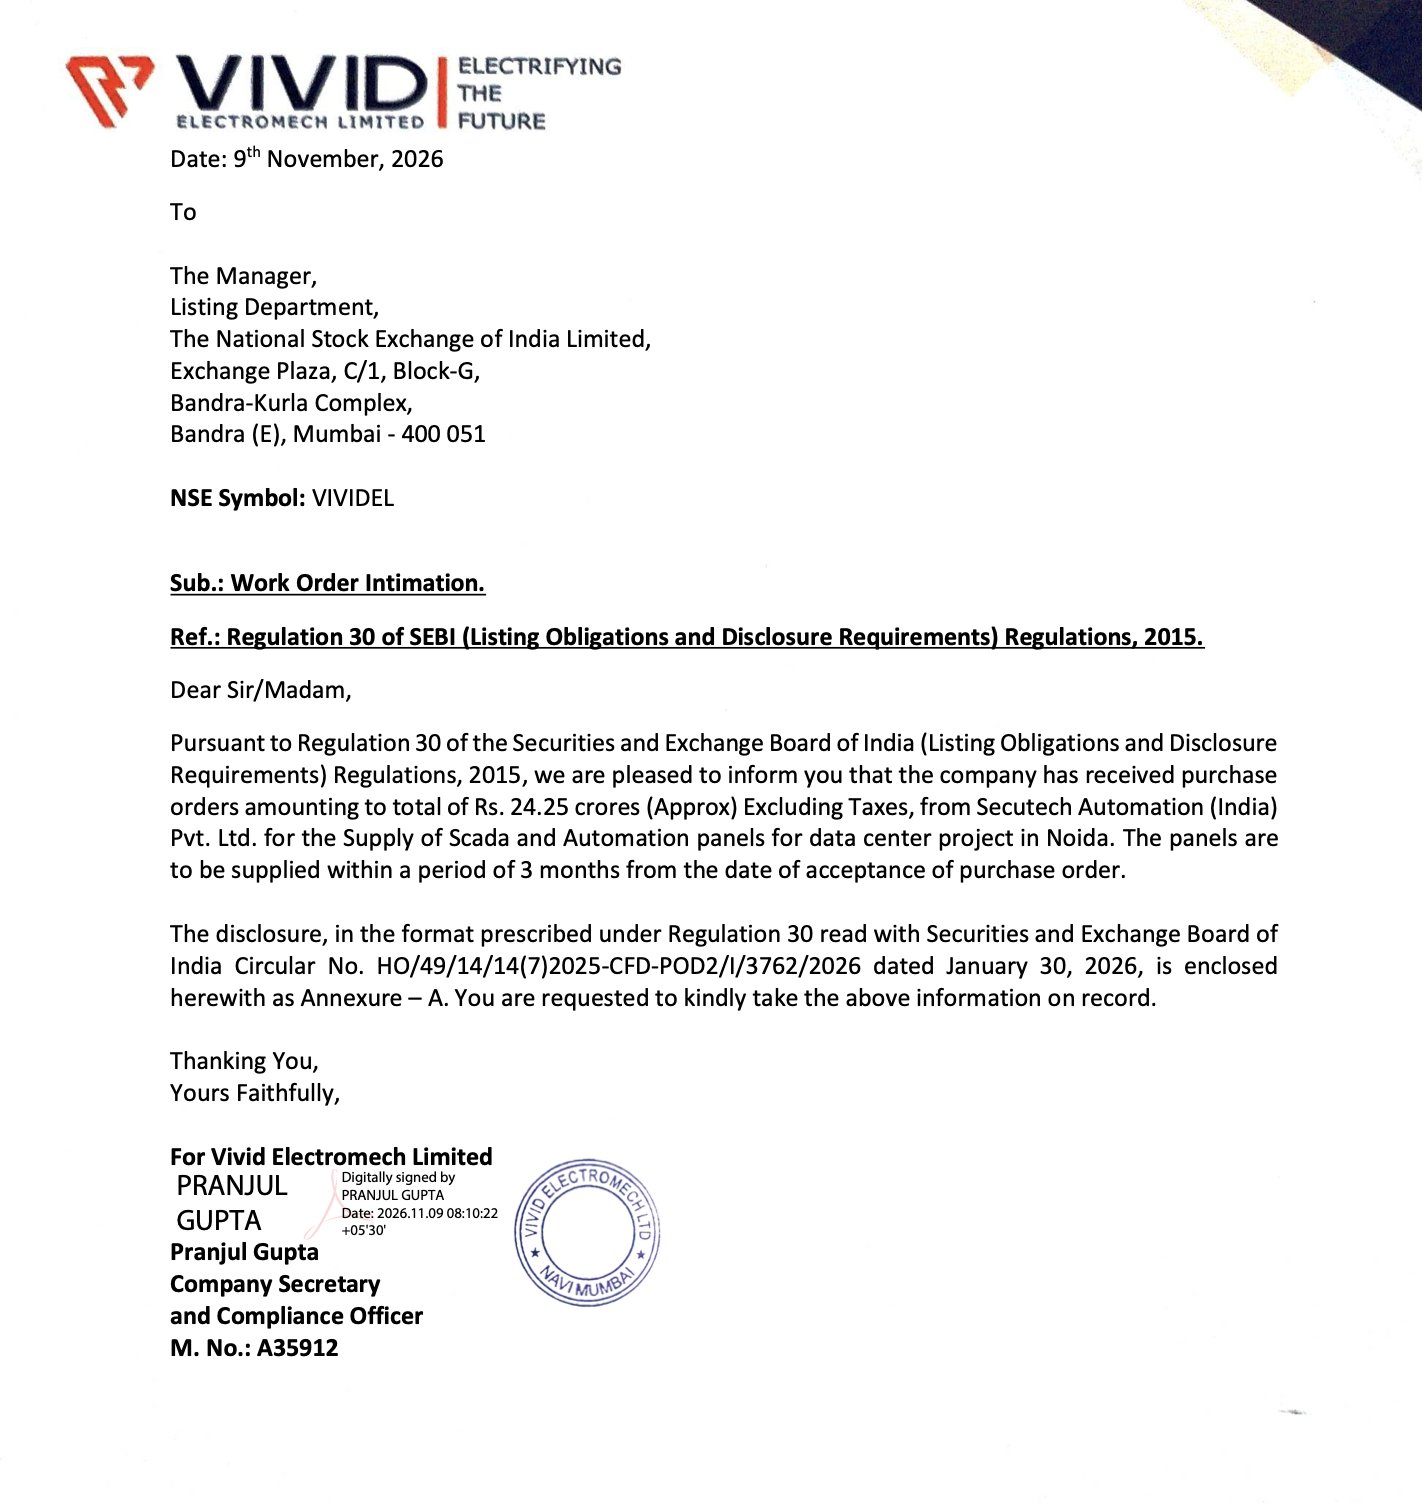
VIVID ELECTROMECH RECEIVES ₹24.25 CRORE ORDER FOR DATA CENTRE PROJECT 🔥🔥🔥
▪️ Vivid Electromech has received purchase orders worth approximately ₹24.25 crore (excluding taxes) from Secutech Automation (India) Pvt. Ltd.
▪️ Scope of work: Supply of SCADA and Automation Panels for a data centre project in Noida.
▪️ Execution timeline: The order is to be executed within 3 months from the date of acceptance of the purchase order.
For informational purposes only. Not a buy/sell recommendation. Please do your own research (DYOR).
Akash Chaudhary retweeted
📊 Which Nifty 50 Stocks Actually Made You Money?
3-year return breakdown of India's biggest companies 👇🏻
Telecommunication
▪️ Bharti Airtel: +114.7%
Capital Goods
▪️ Larsen & Toubro: +29.5%
▪️ Bharat Electronics: +180.3%
Consumer Services
▪️ InterGlobe Aviation (IndiGo): +90.7%
▪️ Adani Ports & SEZ: +140.6%
▪️ Power Grid: +26.0%
▪️ NTPC: +33.1%
▪️ Trent: +100.0%
▪️ Eternal: +211.2%
Consumer Durables
▪️ Asian Paints: -22.1%
▪️ Titan: +40.5%
Construction Materials
▪️ Grasim Industries: +56.1%
▪️ Ultratech Cement: +33.1%
Oil, Gas & Consumable Fuels
▪️ Coal India: +26.0%
▪️ ONGC: +19.1%
▪️ Reliance Industries: 0.0%
Metals & Mining
▪️ Hindalco: +95.3%
▪️ Tata Steel: +40.5%
▪️ JSW Steel: +68.5%
▪️ Adani Enterprises: +12.5%
Information Technology
▪️ Tech Mahindra: +56.1%
▪️ HCL Technologies: +9.3%
▪️ Infosys: -16.9%
▪️ TCS: -27.1%
▪️ Tata Consumer Products: +15.8%
FMCG
▪️ Nestlé India: -3.0%
▪️ ITC: -34.1%
▪️ Hindustan Unilever (HUL): -22.1%
Healthcare
▪️ Max Healthcare: +48.2%
▪️ Cipla: +12.5%
▪️ Dr. Reddy's Labs: +26.0%
▪️ Apollo Hospitals: +68.5%
▪️ Sun Pharma: +60.2%
Automobile & Auto Components
▪️ Tata Motors PV: -29.5%
▪️ Eicher Motors: +114.7%
▪️ Bajaj Auto: +95.3%
▪️ Mahindra & Mahindra: +90.7%
▪️ Maruti Suzuki: +12.5%
Financial Services
▪️ HDFC Life: -14.3%
▪️ Jio Financial Services: -5.9%
▪️ BSE: +464.0%
▪️ SBI Life: +26.0%
▪️ Shriram Finance: +119.7%
▪️ Bajaj Finserv: +6.1%
▪️ Axis Bank: +26.0%
▪️ Kotak Mahindra Bank: +33.1%
▪️ Bajaj Finance: +26.0%
▪️ State Bank of India: +72.8%
▪️ ICICI Bank: +48.2%
▪️ HDFC Bank: -8.7%
ℹ️ For educational purposes only. Not a recommendation. DYODD.


HIGH RELATIVE STRENGTH STOCKS TO STUDY & TRACK 🔥🔥🔥
Laurus Labs
Lenskart Solutions
Coforge
MCX
Ather Energy
Sona BLW Precision
Gland Pharma
Cupid
Sai Life Sciences
Acutaas Chemicals
Sansera Engineering
Welspun Living
Diamond Power
Shadowfax Technologies
Lumax Auto Technologies
Shreeji Shipping Global
Pearl Global Industries
Saregama India
Sri Lotus Developers
SG Mart
Indo Count Industries
M B Agro Products
Unimech Aerospace
Steel Strips Wheels
Entero Healthcare
Neogen Chemicals
Krishna Phoschem
Tourism Finance Corporation of India
Timex Group India
Rolex Rings
Sambhv Steel Tubes
SG Finserve
Nitin Spinners
Yash Highvoltage
Shukra Pharmaceuticals
SBC Exports
Oriental Hotels
Ratnaveer Precision Engineering
M M Forgings
⚪ WHY TRACK RELATIVE STRENGTH?
Relative strength helps identify stocks outperforming the broader market or their respective indices.
▪️ Strong stocks tend to show resilience during market corrections.
▪️ They can attract buying interest when broader market momentum improves.
▪️ Look for sustained outperformance, strong price structures, volume confirmation and healthy consolidations.
▪️ Relative strength is a useful starting point for identifying potential leaders, but fundamental research and risk management remain equally important.
Disclaimer: This is a watchlist for educational and research purposes only. Inclusion does not imply a buy recommendation.
Akash Chaudhary retweeted
📊 FIIs End 17-Month Selling Streak in Indian Equities
FIIs have officially turned net buyers in Indian equities for the first time since June 2025, recording a massive +₹32,231 Crore inflow in November 2026.
After a prolonged selling streak that peaked with massive outflows in early 2026, the tide has finally turned.
#FII #Investing #Nifty50 #Sensex #Nifty

#Susanelectricals
SUSAN ELECTRICALS INDIA – Q2 & H1 FY27 CONCALL 5 MINUTES READ ONLY 🔥🔥🔥
BUSINESS TRANSFORMATION & GROWTH STRATEGY
▪️ Management is shifting the company's focus from being a conventional wire and cable supplier towards becoming a specification-driven power cable manufacturer.
▪️ The immediate priority is to strengthen its presence in three key product categories: HT cables, Medium Voltage Covered Conductors (MVCC) and winding wires.
▪️ Management's personal ambition is to achieve approximately 100% YoY growth in FY28 over FY27. This is an aspiration and not formal revenue guidance.
▪️ Management expects H2 FY27 to be significantly stronger than H1, in line with the company's historical seasonality. Government schemes and EPC contractors generally accelerate tendering and execution from October onwards, with February and March being particularly strong months.
▪️ They indicated that H2 revenue can be around 25–40% higher than H1, depending on order availability and execution capacity. This is an industry seasonality observation, not a company-specific revenue commitment.
ORDER BOOK & ORDER PIPELINE
▪️ Order book stood at ₹147 crore as of September 30, 2026, with an additional active order pipeline of approximately ₹200 crore, taking combined visibility to around ₹347 crore.
▪️ During Q2, the company executed approximately ₹107 crore of orders and received around ₹111 crore of fresh orders.
▪️ Order book composition:
HT cables and MVCC: ₹54 crore
Winding wires: ₹69 crore
LT cables: ₹24 crore
▪️ HT cables/MVCC and winding wires together account for more than 80% of the existing order book, reflecting the company's changing product mix.
▪️ Management stated that a significant portion of the ₹200 crore pipeline had already converted into orders during October. It expected approximately 70–100% of this pipeline to receive Letters of Intent (LOIs) within the following month.
▪️ The ₹200 crore pipeline includes tenders where the company had emerged L1, L2, L3 or L4 and was expecting orders. It should therefore be viewed as pipeline visibility, not as an already confirmed order book.
▪️ Management stated that approximately 90% of the referenced order book was scheduled for execution before March 31, 2027. However, it did not commit to executing the entire ₹347 crore during FY27.
▪️ The pipeline is continuously replenished through fresh bids. The company operates across approximately 15–16 states and continues participating in government tenders and engaging with EPC contractors.
▪️ Management indicated that around 90% of its tender outcomes reach the L3 or L4 level. In government supply tenders, orders can sometimes be allocated beyond L1 through reverse auctions, depending on pricing and tender conditions. The company chooses to accept orders where the pricing is commercially suitable.
CAPACITY EXPANSION & MANUFACTURING
▪️ Cable manufacturing capacity has already increased from 7,500 km to approximately 11,000 km.
▪️ The company plans to further expand cable capacity to 16,000 km, with commercial production targeted from March 2027.
▪️ Management also indicated that capacity could subsequently increase from 16,000 km to 20,000 km within the existing facility.
▪️ Winding wire capacity has increased from 3,307 tonnes to 4,200 tonnes, with further expansion planned to 5,500 tonnes. This represents an overall increase of approximately 66% from the earlier capacity.
▪️ Management clarified that the capacity expansion already completed after the IPO should also be considered when assessing the overall increase. It expects capacity by March 2027 to be more than double the March 2026 level.
▪️ The company is at an advanced stage of taking possession of newly acquired land. Management expected the acquisition to be completed by the following month.
▪️ Construction at the new location is planned to begin before the end of 2026. The company intends to install factory sheds and shift operations during FY28–FY29.
▪️ The new facility will focus on HT cables, MVCC and winding wires. Management does not intend to expand LT cable capacity significantly because of intense competition and relatively lower margins.
▪️ They stated that the new land could eventually support capacity approximately five times the scale of the current expansion.
▪️ The existing facilities are expected to be sufficient for the company's internal growth targets up to March 2028. A major expansion is planned after that.
▪️ The company currently operates three plants at different locations and is considering shifting one or two existing factories to the newly acquired land.
LAND ACQUISITION & FUNDING
▪️ The land acquisition will be funded through a combination of internal accruals and bank borrowings.
▪️ Management explained that approximately 25–30% of the collateral provided against cash-credit facilities is in the form of fixed deposits.
▪️ The company has approximately ₹48 crore of fixed deposits, including ₹5.62 crore of pledged mutual funds, placed as collateral against bank cash-credit limits.
▪️ Once the new land is acquired and becomes operational as collateral, management expects to release some of the existing fixed deposits and other collateral.
▪️ Management also indicated that the new land is substantially cheaper than the existing UPSIDC industrial-area land. It quoted approximately ₹1 lakh per square yard for land in the UPSIDC industrial area versus around ₹10,000 per square yard for the newly acquired land.
▪️ The company may eventually shift existing factories and release or sell some of its current properties, subject to collateral release and bank revaluation. Management believes this could unlock capital and support future expansion.
▪️ Management stated that a significant portion of the current year's capex has already been undertaken and advances have been paid. It does not currently foresee a funding crunch over the next few years.
▪️ The company has not provided a firm asset-turnover target for the new plant. Management said it would be possible to assess this after the plant becomes operational and reaches the required capacity.
PRODUCT MIX & REVENUE CONTRIBUTION
▪️ Q2 revenue mix was approximately:
HT cables and MVCC: 30%
Winding wires: 33%
LT cables: 31%
▪️ Management expects HT cables and MVCC to contribute around 40–50% of FY27 business, winding wires approximately 40%, and LT cables around 10–20%.
▪️ For FY28, management reiterated its ambition to move towards a product mix of approximately 45% HT cables/MVCC, 45% winding wires and 5–10% LT cables.
▪️ HT cables and MVCC contribution has increased substantially from approximately 0.75% of H1 FY26 revenue to around 30% in Q2 FY27.
▪️ For the full FY26, HT cables and MVCC had contributed approximately 8.57% of revenue.
▪️ Winding wire sales grew 109% in H1 FY27. Management considers this a core business with relatively fewer organised players and attractive margins.
▪️ Management is deliberately reducing its dependence on LT cables. LT was previously a much larger part of the business, but its contribution has now come down to approximately 30% in Q2.
▪️ HT cable machines can also manufacture LT cables, whereas LT cable machines cannot manufacture HT cables. This provides some manufacturing flexibility as the company shifts towards higher-value products.
Q2 SALES VOLUMES & UNIT ECONOMICS
▪️ Q2 sales volumes:
HT cables and MVCC: 518 km
LT cables and conductors: 1,498 km
Winding wires: 937 tonnes
▪️ For comparison, Q1 sales volumes were:
HT cables: 176 km
LT cables: 3,641 km
Winding wires: 554 tonnes
▪️ HT cable volumes increased from 176 km in Q1 to 518 km in Q2, while winding wire volumes increased from 554 tonnes to 937 tonnes.
▪️ Management also shared EBITDA earned per unit for H1:
HT cables and MVCC: ₹75,808 per km
LT cables: ₹22,252 per km
Winding wires: approximately ₹45 per kg
▪️ In H1 FY26, the corresponding figures were:
HT cables: ₹21,084 per km
LT cables: ₹18,279 per km
Winding wires: approximately ₹40 per kg
▪️ For Q2, management separately indicated EBITDA per unit of approximately:
HT cables: ₹81,987 per km
LT cables: ₹25,007 per km
Winding wires: ₹44 per kg
CCV LINE & HT CABLE OPPORTUNITY
▪️ The new CCV (Continuous Catenary Vulcanisation) line has arrived at the factory and was at the installation stage during the call. Management expected it to become operational within a few days.
▪️ CCV technology uses dry curing. Management explained that most states have made CCV/dry-curing technology mandatory for HT cable supplies.
▪️ The new line is therefore an important capability addition, allowing the company to participate in larger and more complex HT cable tenders that it could not fully access earlier.
▪️ The company currently manufactures HT cables up to 33 kV and plans to move into higher voltage categories.
▪️ Management expects to obtain the required BIS certification for higher-voltage products within approximately 2–3 months and intends to announce the development after certification.
▪️ The company has started participating in more government HT tenders following the expansion of its capabilities.
▪️ Management cited examples of the company emerging L1 in 11 kV and 33 kV MVCC tenders in Paschimanchal Meerut and an HT tender in Madhya Pradesh.
MARGINS & PRODUCT PROFITABILITY
▪️ Management indicated the usual EBITDA margin ranges across products:
HT cables: 12–14%
Winding wires: 10–13%
LT cables: 9–11.5%
▪️ Q2 segment EBITDA margins were approximately:
HT cables and MVCC: 13.13%
Winding wires: 11.82%
LT cables: 11%
▪️ Management expects the overall profitability profile to improve as the contribution of HT cables, MVCC and winding wires increases.
▪️ The company is consciously reducing lower-margin LT cable orders and rejecting orders where the pricing is not attractive.
▪️ Management clarified that the previous year's unusually high EBITDA margins were partly due to abnormal movements in copper and aluminium prices, which resulted in one-time gains.
▪️ Management does not see a current reason for margins to deteriorate, but did not provide a specific numerical margin target for FY28.
CUSTOMER MIX, TENDERING & RAW MATERIAL PRICING
▪️ H1 business mix was approximately 50% government customers and 50% private-sector/EPC customers.
▪️ Earlier, approximately 90–95% of the company's business came from government customers. The company has gradually increased its EPC/private-sector contribution.
▪️ Management is giving greater preference to EPC business because of faster payments, advances and letters of credit.
▪️ Approximately 90% of EPC contractor orders carry price-variation clauses.
▪️ Management clarified that private-sector customers also provide price-variation clauses for orders with longer execution periods. Firm-rate orders are generally supplied immediately, usually within a month.
▪️ Since raw material prices are covered through price-variation arrangements in most orders, management stated that it does not need to hedge conductor orders separately.
▪️ Government payments to MSMEs generally arrive within approximately two months. EPC customers generally pay within 20–30 days or around a month, often through letters of credit.
▪️ The company supplies material with freight included. Management stated that freight is a relatively small proportion of its overall cost because the products are high-volume materials.
WORKING CAPITAL, RECEIVABLES & CASH FLOW
▪️ Management confirmed that operating cash flow has turned positive and expects further improvement in the coming quarters.
▪️ Receivables stood at approximately ₹95 crore as of September 30, 2026.
▪️ Of this, approximately ₹25 crore related to sales made in the last 5–6 days of September and was not yet due.
▪️ The company received approximately ₹44 crore in October against receivables.
▪️ Only around ₹4 crore, or approximately 5% of total receivables, was older than 180 days. Management stated that around ₹3.5 crore of this had already been collected in October, leaving approximately ₹50 lakh outstanding beyond 180 days at the time of the call.
▪️ Management has made collections and inventory control key priorities. It stated that inventory is now being managed more efficiently rather than holding excessive stock to support growth.
▪️ The company uses TReDS to facilitate supplier payments. Under this arrangement, financiers pay suppliers directly, helping the company manage working capital.
▪️ Management indicated TReDS financing costs of approximately 9–12%, compared with around 8–8.5% on bank limits.
▪️ Management explained that TReDS can also help secure vendor discounts because suppliers receive their payments quickly. The facility is expected to continue being used.
▪️ The company currently does not see any working-capital stress and stated that the facilities arranged for FY27 are sufficient for the year.
▪️ Management is already making arrangements for higher working-capital requirements as the business expands in FY28.
DEBT & FINANCE COSTS
▪️ As of September 30, total borrowings stood at approximately ₹122 crore, comprising:
Short-term borrowings: ₹115 crore
Long-term borrowings: ₹7 crore
▪️ Cash and cash equivalents, including investments and short-term bank balances, stood at approximately ₹61 crore.
▪️ This translated into an effective net debt level of approximately ₹60 crore, which management said was broadly similar to the March 31 position.
▪️ Management clarified that a significant amount of the borrowings is connected with fixed deposits and other collateral placed against cash-credit limits.
▪️ Management expects the release of some collateral following the acquisition and use of the new land as security, subject to bank approvals and additional limits.
▪️ The finance team indicated that major capex is being funded through IPO proceeds and that the company intends to fund a substantial portion of future capex through operating cash flow.
▪️ Management does not currently expect a significant increase in finance costs and indicated that there could be scope for a reduction.
RAILWAYS, DEFENCE & OTHER OPPORTUNITIES
▪️ Railways: The company has already entered the railway segment and is supplying material to Indian Railways and RVNL.
▪️ Management stated that the company has completed 3–4 railway tenders and continues to receive orders from this segment.
▪️ Coalfields: The company has also supplied material under Coalfields tenders.
▪️ Defence: The company is exploring entry into the defence segment but had not received a defence tender at the time of the call.
▪️ CTC winding wires: Research and development for continuously transposed conductors (CTC) is underway.
▪️ Management stated that the company can begin CTC production with a smaller order by installing additional machines. Large-scale production would require dedicated machinery and a separate laboratory.
▪️ The company is not currently manufacturing CTC because it has not yet received an order, but management intends to pursue the opportunity.
▪️ Management stated that the company already holds 12 BIS certifications across its product portfolio.
▪️ The company recently completed registration in Uttarakhand for products up to 33 kV MVCC and is seeing good quantities going into the state.
▪️ Management does not currently plan to enter unrelated products such as capacitors or insulators. The immediate focus is to scale the existing portfolio of winding wires, HT cables, LT cables, conductors and MVCC.
EXPORT MARKET & TRADING BUSINESS
▪️ They stated that the company had previously been more aggressive in exporting winding wires, but current domestic demand and margins are attractive.
▪️ At the time of the call, management did not see any immediate export order for winding wires and was primarily catering to the Indian market.
▪️ Trading activity is now very limited, accounting for less than 2% of business and mainly relating to raw-material-related items and scrap.
▪️ Management clarified that earlier metal trading was undertaken during an unusual period of significant commodity-price movements. It is not part of the company's future business plan.
KEY MANAGEMENT CLARIFICATIONS
▪️ The company does not currently have any 3–5-year long-term supply contracts with winding-wire customers. Management said it would consider such contracts if suitable opportunities arise.
▪️ Customer names have not been disclosed because management considers this information commercially confidential.
▪️ Management has agreed to consider publishing more information on order wins, cash flow and product realisations in future disclosures, subject to what it is permitted to disclose.
▪️ Management also acknowledged investor suggestions to provide more regular updates on orders and business developments.
KEY THINGS TO TRACK
▪️ Commissioning of the CCV line and subsequent ramp-up in HT cables and MVCC.
▪️ Cable capacity expansion from 11,000 km to 16,000 km by March 2027, followed by the planned increase towards 20,000 km.
▪️ Winding wire capacity expansion from 4,200 tonnes to 5,500 tonnes.
▪️ Conversion of the ₹200 crore active pipeline into confirmed orders.
▪️ Execution of the ₹147 crore order book and the additional pipeline visibility.
▪️ Progress towards the targeted FY27 and FY28 product mix.
▪️ Higher-voltage HT cable BIS certification and development of CTC winding wires.
▪️ Completion of the new land acquisition, construction and planned FY28–FY29 expansion.
▪️ Further improvement in operating cash flow, receivables and inventory management.
▪️ Management's ability to maintain margins while scaling manufacturing capacity and increasing the share of higher-value products.
Disclaimer: This post is for educational purposes only and is not a buy or sell recommendation. Please conduct your own fundamental and technical research before making any investment decisions. DYDD.

DANISH POWER – H1 FY27 ONLY 2 MINUTES CONCALL READ 🔥🔥🔥
⚪ REVENUE GUIDANCE & OUTLOOK
▪️ FY27 revenue guidance of ₹700 crore+, with management prioritising margin preservation.
▪️ FY28 revenue target of ₹950–990 crore, assuming peak capacity utilisation.
▪️ Management reiterated that the business is structurally H2-heavy, with stronger execution expected in the second half.
▪️ Management believes current demand is structural rather than cyclical, driven by rising power consumption, BESS, renewables, thermal power, transmission and distribution, and exports.
⚪ ORDER BOOK & DEMAND
▪️ Confirmed order book stands at ₹600 crore+, with deliveries scheduled over the next 6–9 months.
▪️ Around 70–80% of orders come from repeat customers. Order book mix is approximately 80% private sector and 20% PSU.
▪️ BESS-related requirements contribute approximately 20% of the order book and around 10% of H1 execution, driven by solar-plus-storage projects and retrofitting existing solar installations.
▪️ Management reported healthy inquiry inflows, higher than earlier levels, across its major business segments.
⚪ MARGINS & RAW MATERIAL
▪️ Management aims to maintain margins at broadly similar levels in FY27, with profitability taking priority over aggressive volume growth.
▪️ Raw material price volatility and freight disruptions are being managed through price variation clauses, selective order pricing and customer-supplier relationships.
▪️ Management does not expect significant raw material cost carryover into H2, as most orders in the current order book are from April onwards. However, geopolitical uncertainty remains.
▪️ Export margins are not consistently higher than domestic margins. They depend on geography and project economics and can be at par or marginally higher.
⚪ CAPACITY EXPANSION & CAPEX
▪️ Phase-3 expansion: Additional capacity of approximately 15,000 MVA, taking total installed capacity to around 26,000 MVA.
▪️ Estimated capex of ₹200 crore, with site work planned around December 2026 and commissioning expected within 18–24 months.
▪️ The new facility will focus on 132 kV, 220 kV and 400 kV EHV transformers, marking Danish Power's entry into the 400 kV segment.
▪️ Around 30–40% of the new capacity is planned for international markets, as export demand continues to grow.
▪️ Funding is expected through approximately ₹100 crore of internal accruals and ₹80–100 crore of debt. Management stated that the company currently has no debt on its books.
⚪ UTILISATION & BACKWARD INTEGRATION
▪️ The Phase-2 expansion became operational in January, activating the power transformer division.
▪️ H1 production output was approximately 500 MVA, with management indicating around 60% utilisation of the expanded 11,000 MVA facility.
▪️ Management expects utilisation to reach approximately 90–92% in FY28, which it considers the typical peak level in transformer manufacturing.
▪️ A fully automated radiator manufacturing plant is expected to be commissioned by the end of November, covering approximately 80–90% of radiator requirements. Radiator delays have been a key bottleneck for delivery timelines and quality consistency.
▪️ In-house tank manufacturing currently covers approximately 20% of total requirements.
⚪ PRODUCT MIX & CERTIFICATIONS
▪️ Power transformers are expected to contribute around 15% of FY27 product mix.
▪️ 132 kV transformers: LOI received, with type testing expected in Q4 FY27.
▪️ 220 kV transformers: LOI expected shortly, with type testing targeted for Q1 FY28.
▪️ Railway-sector opportunities are at an advanced stage, providing another potential growth avenue beyond industrial and distribution transformers.
⚪ EXPORTS & INDUSTRY DEVELOPMENTS
▪️ Export contribution increased from approximately 8% in FY26 to 15% in H1 FY27. Management is targeting profitable export growth rather than volume-led expansion.
▪️ Management indicated that exports account for more than 25% of private-sector orders, while also referring to approximately 20% overall export contribution in the order book. The figures were not entirely consistent during the call.
▪️ The US market remains largely untapped and is currently under evaluation, while existing capacity is being prioritised for Europe and the Middle East.
▪️ Export payments are largely secured through confirmed LCs or ECGC cover. Currency risks are managed through natural hedging, forward contracts and foreign currency accounts.
⚪ WORKING CAPITAL & OTHER DEVELOPMENTS
▪️ Operating cash flow is expected to turn positive in FY28. Growth-related working capital requirements are likely to remain elevated in the near term.
▪️ Additional working capital limits of approximately ₹40–50 crore may be required due to longer production cycles for higher-voltage transformers.
▪️ The approximately ₹14 crore increase in borrowings between March and September was clarified as a subsidiary term loan for sheet-metal fabrication backward integration.
▪️ Main-board migration eligibility completes in October 2027, with the company planning to apply approximately 3–4 months earlier.
⚪ KEY THINGS TO TRACK
▪️ Execution of the ₹600 crore+ order book and achievement of FY27 revenue guidance.
▪️ Commissioning of the radiator plant and improvement in delivery timelines.
▪️ Progress on 132 kV and 220 kV certifications and entry into the 400 kV segment.
▪️ Phase-3 expansion, export growth and utilisation ramp-up towards 90–92% in FY28.
▪️ BESS order conversion, working capital management and the expected improvement in operating cash flow.
Disclaimer:
For educational purposes only. Not a buy or sell recommendation. Please do your own research before making any investment decisions. DYDD.


