

Crypto market intelligence. On-chain, macro, derivatives, sentiment. Insights: https://xitter.gq/t.co/h2cWqiqfew Reports: https://xitter.gq/t.co/qUjW8GFOTm
Global
Joined June 2023
- Tweets3.4K
- Following221
- Followers15.2K
- Likes2.6K



🚨 NOVEMBER 3 IS APPROACHING! WILL BITCOIN CRASH AGAIN?
There is a fascinating historical pattern surrounding the United States midterm elections that deserves investors' attention!
During the last three midterm election cycles, Bitcoin experienced bear markets and reached significant cycle bottoms shortly after the elections.
• 2014 (November 4): Bitcoin was already experiencing a prolonged bear market. Selling pressure continued after the elections, and BTC eventually reached its cycle bottom in January 2015.
• 2018 (November 6): Bitcoin was trading near $6,400. After a period of relative stability, BTC suffered a sharp decline, losing approximately 40% over the following month and reaching its cycle bottom in December.
• 2022 (November 8): Bitcoin had already experienced substantial losses when the FTX collapse occurred, almost simultaneously with the midterm elections. BTC plunged toward $15,500, marking the bottom of that cycle.
• 2026 (November 3): We are once again approaching a U.S. midterm election amid economic uncertainty and following a significant Bitcoin correction.
But here is something even more interesting!
During all three previous midterm elections, Bitcoin was already in a bear market before Election Day.
This raises an important question: Do midterm elections actually influence these declines, or are we simply observing a coincidence between Bitcoin's four-year cycle and the U.S. electoral calendar?
After all, correlation does not imply causation!
And now, in 2026, has Bitcoin already reached its cycle bottom, or could another major decline still be ahead?
The historical pattern is intriguing, but three occurrences are not enough to establish a reliable rule.
What do you expect Bitcoin to do after November 3?
Alphractal.com


Bitcoin Open Interest Is Revealing an Interesting Pattern in 2026!
Bitcoin's Open Interest (OI), measured in BTC, has increased by +36.7% in 2026, already surpassing the historical median year-end change of +26.4% over the past six years.
But things get even more interesting when we analyze historical correlations!
• 2025: Correlation of 0.79
• 2022: Correlation of 0.62
This means that Bitcoin's Open Interest trajectory in 2026 shows a strong statistical resemblance to the patterns observed in 2025, followed by 2022.
However, the historical outcomes were significantly different!
• 2022 ended with a +69.9% increase.
• 2025 finished with a 12.5% decline.
• Open Interest increased in 4 of the past 6 years.
What can we learn from this?
Even amid uncertainty and corrections across the crypto market, derivatives positioning continues to expand significantly in 2026.
It's important to understand that rising Open Interest doesn't necessarily indicate buying pressure. It can also reflect growing short exposure, increased leverage, and the potential for major liquidation events.
And here's a crucial detail: correlation does not mean the market will repeat the same outcome!
The trajectory of 2026 could still diverge significantly from previous years, especially during the final two months of the year.
Is the market building a new positioning structure, or simply repeating historical patterns before a major shift?
Data > Narratives.


Take advantage of your last chance to get 50% OFF our best plans!
🔥app.alphractal.com

Bitcoin may be breaking one of the most consistent historical patterns of its bear market cycles!
Historically, Bitcoin's major bear markets have taken approximately one year, or slightly longer, to establish their definitive bottoms.
Let's look at the duration of previous cycles, measured from peak to bottom:
• 2013–2015: 406 days
• 2017–2018: 363 days
• 2021–2022: 376 days
• 2025–2026: 386 days since the peak, so far.
But there are two particularly interesting observations worth highlighting!
1. The bottom may have occurred earlier than expected!
The lowest price recorded in the current cycle occurred on June 30, 2026, just 267 days after the peak.
If that was indeed the definitive bottom, we could be witnessing a significant shift in Bitcoin's historical cycle timing, breaking a pattern observed across the previous three major bear markets.
2. We are still within the historical window for another bottom!
Despite the recovery since June, the current cycle remains within the historical range of 363 to 406 days.
This means Bitcoin could still establish a new low in the coming weeks, particularly within the next 20 days, without necessarily deviating from the timing observed in previous cycles.
This possibility may seem increasingly unlikely to many market participants, but it cannot be ruled out simply because time has passed.
The big question is:
Are we witnessing, for the first time across these major cycles, a significant shift in the timing of Bitcoin's bear market?
Or is it still too early to conclude that a historical pattern has been broken?
Markets don't follow absolute rules. Data reveals patterns, but it never guarantees their repetition.
Data > Narratives.

Take advantage of your last chance to get 50% OFF our best plans!
app.alphractal.com
🇧🇷 Brazil heads to the polls today, but what does monetary history reveal about the future of its economy?
Over the past two decades, Brazil has experienced different governments, economic crises, shifts in monetary policy, and periods of significant appreciation and decline in the Ibovespa.
Our charts highlight two fundamental indicators for understanding this history: Brazil's M2 Money Supply and the Central Bank of Brazil's balance sheet, including their year-over-year (YoY) changes.
In 2008, the global financial crisis triggered a sharp market correction, followed by significant shifts in monetary conditions.
Between 2015 and 2016, Brazil experienced a deep recession, accompanied by substantial contractions in the annual changes of both monetary indicators.
Then, in 2020, the pandemic introduced extraordinary economic disruption, with sharp fluctuations in liquidity and monetary conditions.
Now, in October 2026, something particularly interesting is happening:
- Brazil's M2: R$1.57 trillion, with an annual increase of approximately R$239.28 billion.
- Central Bank of Brazil: R$825.47 billion, with an annual increase of approximately R$64.59 billion.
- Ibovespa: Approximately 205,000 points, trading near historical highs.
The YoY charts reveal something important: monetary expansion and contraction occur in cycles, and these shifts have historically coincided with major turning points in Brazil's financial markets.
After periods of negative annual changes, both indicators are now back in positive territory, suggesting renewed monetary expansion.
But this raises an important question:
How much of the appreciation in Brazilian financial assets reflects real economic growth, and how much is influenced by monetary expansion, inflation, and changing liquidity conditions?
Monetary expansion does not automatically translate into higher stock prices, but understanding these cycles provides valuable context for investors.
Presidents come and go. Economic cycles change. But the relationship between money, interest rates, confidence, and asset prices remains fundamental.
Today, Brazil chooses its next president. For investors, one of the biggest questions is how the next administration's economic policies will shape liquidity, monetary stability, and capital markets in the years ahead.
📊 More than two decades of Brazil's monetary and financial history, visualized through Alphractal.
Alphractal | Data Beyond the Market.


Alphractal retweeted

$BTC , $ETH , $SOL , $HYPE , and many other cryptocurrencies have seen a significant buildup of long positions over the past few days.
Hyperliquid's Long/Short Ratio has reached its highest level ever recorded.
This could likely prevent the market from continuing to move higher...


Alphractal retweeted
Bitcoin encountered its first major intermediate resistance as it reached the 2026 yearly open, exactly as I anticipated several weeks ago!
This level also aligned with key signals from some of the most reliable market metrics, creating a strong confluence of resistance.
I believe we'll have plenty of opportunities ahead to accumulate BTC with more patience and at better prices.


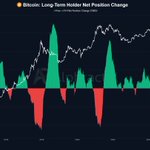
Bitcoin Long-Term Holders: A Critical Shift in Supply Dynamics!
Bitcoin's Long-Term Holder Net Position Change remains positive at +1.27 million BTC over the past 180 days, but the pace of growth is slowing significantly.
Historically, major shifts in this metric have coincided with important transitions in Bitcoin's market cycles.
While long-term holder supply continues to expand, the recent decline in momentum deserves close attention.
Is this just a temporary slowdown, or the early stages of a new distribution phase?
Data: Alphractal.com

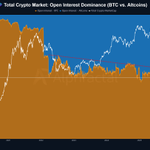
Bitcoin once dominated the crypto derivatives market, accounting for over 90% of total Open Interest. That landscape has changed dramatically.
Analyzing data from 30 of the largest crypto exchanges, altcoins now account for 57.4% of total Open Interest, while Bitcoin represents 42.6%, a difference of 14.8 percentage points.
This structural shift shows how derivatives exposure has expanded beyond Bitcoin, making altcoins increasingly important in understanding market volatility, liquidity dynamics, and liquidation risk.
Bitcoin alone no longer tells the full story of the crypto derivatives market.
Alphractal.com

Alphractal retweeted
The Bitcoin Stablecoin Ratio Channel is a powerful metric for analyzing Bitcoin's market cycles.
It tracks the relationship between Bitcoin and stablecoins, helping identify shifts in relative liquidity and potential market transitions.
Stablecoins are one of the key pillars of liquidity in the crypto market! Without them, liquidity would decline dramatically, spreads would widen, and price discovery would become far less efficient.
Understanding stablecoin dynamics is essential to understanding crypto market cycles!

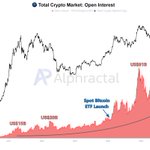
The 5-Year History of Open Interest in the Crypto Market!
The cryptocurrency derivatives market has undergone an incredible transformation over the past five years.
In 2021, total Open Interest across crypto exchanges was approximately $15 billion. In 2022, it reached around $20 billion before experiencing a significant contraction during the bear market.
In January 2024, we witnessed a historic milestone: the launch of Spot Bitcoin ETFs in the United States.
Following this event, the derivatives market experienced remarkable growth, accompanied by greater institutional participation, increased liquidity, and rising interest in leveraged positions.
Open Interest surpassed $91 billion in 2025 and eventually reached an all-time high of approximately $155 billion!
After a massive deleveraging event that pushed Open Interest down to around $54 billion, the market recovered, climbing back to $120 billion.
Today, total Crypto Open Interest stands at $100.4 billion, approximately 570% higher than its 2021 levels.
Bitcoin alone accounts for $42.6 billion, representing 42.4% of all outstanding positions across the crypto market.
These numbers highlight how much the market has evolved and how derivatives have become an increasingly important part of the crypto ecosystem.
But there is one crucial detail: higher Open Interest also means greater exposure to sudden market movements, deleveraging events, and cascading liquidations.
The market has grown. Leverage has grown with it. And understanding the data has never been more important.

🇺🇸 Only 15 days until the U.S. Midterm Elections!
Great analysis by @Satourei using Alphractal data!
In both 2018 and 2022, Bitcoin experienced significant corrections before recovering in the following year.
Will history repeat itself in 2026?
Great work! Give @Satourei a follow for more data-driven crypto insights!

$BTC and the U.S. Midterm Elections: Is History About to Repeat Itself?
According to @Alphractal data, Bitcoin is approaching the U.S. midterm elections on November 3, 2026, while $BTC is currently trading around $82,600.
Notably, during the previous two midterm election cycles in 2018 and 2022, Bitcoin experienced significant corrections before forming a bottom and entering a recovery phase in the following year.
In 2018, $BTC bottomed out toward the end of the year and recovered throughout 2019. Similarly, after the downturn in 2022, Bitcoin began a strong recovery cycle in 2023.
Could a similar cycle structure be emerging in 2026?

The crypto market is seeing its lowest level of Google search interest since 2023.
A sign of widespread disbelief and declining global interest.


Fear & Greed: Stocks vs. Crypto!
The stock market is currently at 18 (Extreme Fear), while the crypto market stands at 55 (Neutral).
An interesting divergence in investor sentiment, showing that fear is much more prevalent in stocks than in cryptocurrencies right now!


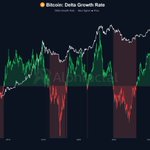
Bitcoin: Delta Growth Rate Shows Signs of Recovery!
The Delta Growth Rate is a metric that combines the growth of Market Cap and Realized Cap, helping identify divergences between Bitcoin's price appreciation and the accumulation of on-chain value.
Historically, negative values have been associated with periods of weaker speculative activity, accumulation, and potential undervaluation.
Currently, the indicator remains in negative territory, but it has been recovering since July 2026!
This movement suggests a gradual improvement in market dynamics, although it is still not enough to confirm a structural trend reversal.
The big question now is: Will this recovery be strong enough to push the Delta Growth Rate back into positive territory?
Explore this and other metrics at Alphractal.com.
