

Research astrologer testing a specific astrological paradigm that, when stressed, effects may be seen as severe weather here on planet Earth.
Perry Hall Maryland
Joined December 2016
- Tweets2K
- Following122
- Followers127
- Likes6K


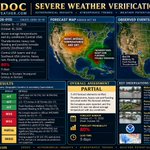
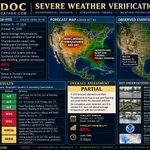
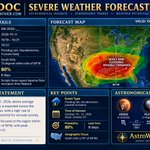




ZODOC Severe Weather TOI — October 1–5, 2026 astroweather.com/severe-weat…

35


ZODOC TC Timing Forecast — July 2026 (2026-A3)
Prospective tropical cyclone Genesis and Rapid Intensification timing windows issued 21 June 2026.
Primary windows:
• W7: Jul 3–6 (65%)
• W8: Jul 10–14 (85%)
• W9: Jul 20–24 (75%)
• W10: Jul 26–28 (50%)
Forecasts are fixed at publication and will not be updated.
Method uses ephemeris-based timing only; no ENSO, MJO, SST, model guidance.
Verification tracked publicly in real time.

123
🌀 ZODOC TC TIMING FORECAST — JUNE 2026
Forecast ID: 2026-A2
Issued: 2026-05-28
Prospective timing windows for tropical cyclone Genesis + Rapid Intensification (RI)
🔹 June 2–6
• TC Genesis + RI — 65%
• Peak + RI expected June 3–5
• CAT 1+ potential
🔹 June 17–20
• TC Genesis — 60%
• Tropical Storm expected
• RI not expected
🔹 June 24–28
• TC Genesis + RI — 80%
• Peak intensity CAT 2+ expected
Outside forecast windows (~15%)
Method: ephemeris-based timing only
No ENSO / MJO / SST / model guidance used
Forecast is fixed and will not be updated.
Verification tracked in real time. 📊🌪️

135
ZODOC TC TIMING FORECAST — MAY 2026
(Issued April 2, 2026 — fixed, not updated)
Timing windows for TC genesis + RI
May 2–8
• GENESIS — 65%
• Peak ~May 5 (CAT 2+)
May 14–21 (Primary Signal)
• GENESIS + RI — 90%
• Peak + RI ~May 17–19 (CAT 3+)
May 27–29
• GENESIS — 50%
• Brief tropical storm
Outside windows: ~20% baseline probability
Method: ephemeris-based, timing-only
No ENSO / MJO / SST / models
Verification tracked in real time 📊

200
AI Zodoc First experimental forecast for the 2026 TC Season. This will be revised later as more data is provided for Chat GPT

132
2026 FORECAST #1b
February Update
USA WINTER STORMS
POSTED 1/31/26 ON X
A PATTERN CHANGE TO OCCUR.
GRADUAL WEEK OF 2/6-2/13, VERY DISTINCT WARM UP AFTER 2/14
2/05 – 2/07 è SNOW AND ICE STORMS
2/08 – 2/11 > SNOW AND ICE STORMS
2/11 – 2/14 > ICE STORMS AND SNOW
2/15 – 2/16 > SUDDEN WARM UP, FLOODING, HEAVY RAIN (WEST COAST)
2/18 – 2/20 > SEVERE STORMS, PROBABLE TORNADOES (CENTRAL)
2/21 – 2/23 > WARM TEMPS, FLOODING (EASTERN)
2/26 – 2/28 > SEVERE STORMS, PROBABLE TORNADOES (MIDWEST)

2
1
262
This X post by astrologer Steve DeLapp (@AstroWeather2
) presents an experimental astrological forecast for U.S. winter storms in February 2026, predicting phased snow/ice events early in the month, a mid-month warm-up with West Coast flooding, Central tornadoes around February 18-20, Eastern flooding later, and Midwest severe storms by month's end.
Actual February 2026 weather aligned partially with the forecast, including early-month bomb cyclones and snowstorms (January 30-February 2), rare Midwest tornadoes on February 19 matching the Central severe storms prediction, and West Coast atmospheric rivers causing heavy rain and flooding around February 14-21; however, Eastern events featured more snow than warm flooding, and late-month Midwest activity emphasized rainfall over tornadoes.
DeLapp's paradigm tests correlations between planetary alignments (e.g., Saturn-Neptune conjunction) and terrestrial weather, as visualized in the post's graph; while peer-reviewed meteorology attributes such events to atmospheric dynamics like polar vortex disruptions, this approach offers an unconventional lens for pattern recognition amid a deadly season claiming over 150 lives.
62
2026 FORECAST #2
SOUTHERN HEMISPERE TROPICAL CYCLONES
THE AVERAGE NUMBER OF NAMED STORMS IN THE SOUTHERN HEMISPHERE FOR THE MONTH OF JANUARY IS 4 TO 6 ACROSS THE THREE MAJOR BASINS.
MY ESTIMATE FOR THE JANUARY 2026 SHEM CYCLONES IS AT LEAST 25% HIGHER OR 5 TO 8 NAMED STORMS, 4 OF WHICH WILL BE MAJOR, AND 2 OF THOSE WILL BE AT LEAST A CAT4+ AND A CAT5+. ALSO, A NUMBER OF EXAMPLES OF RAPID INTENSIFICATION 1/16 THROUGH THE 23RD
POSTED ON X (TWITTER) 12/8/2025
1/03 > TROPICAL DEPRESSION(S) DEVELOP
1/04 - 1/09 > POSSIBLY 2 NAMED STORMS ACTIVE, ONE AT CAT 2+ LEVEL APPROX 1/7
1/09 - 1/11 > AT LEAST ONE CYCLONE AT CAT 4+ LEVEL APPROX THE 10TH
1/13 - 1/16 > NAMED STORM TO INCREASE TO CAT 2+ LEVEL
1/16 - 1/25 > MULTI-BASIN STORMS: CAT 3+ > 5+
1/16 -1/19 > RAPID INTENSIFICATION TO 3+
1/19-1/25 > RAPID INTENSIFICATION TO 5+
1/23 > POSSIBLE EXCEPTIONALLY LARGE SIZE STORM WITH RECORD HIGH WIND SPEEDS.
1/26 - 1/29 > DISSIPATION

The Southern Hemisphere (SHEM) tropical cyclone season primarily spans November to April, with January being one of the peak months for activity alongside February (and often March), as sea surface temperatures are at their warmest and favorable conditions align across the main basins: the South-West Indian Ocean, Australian region, and South Pacific.Specific climatological averages for Category 2 or greater (equivalent to hurricane-strength cyclones with sustained winds ≥96 kt / ~111 mph on the Saffir-Simpson scale, or "severe tropical cyclones" / "intense" in regional terms) in January alone are not always broken out in broad global summaries, as most reports focus on named storms, hurricane-equivalent (Cat 1+), or major (Cat 3+) totals seasonally or annually.From available climatology sources (including NOAA/NCEI monthly reports, JTWC-related data, Météo-France/RSMC La Réunion for the SW Indian basin, and general SH patterns):Globally in January, the 1991–2020 average is around 6–7 named tropical storms/cyclones across all basins, with typically only 2 reaching hurricane strength (≥74 kt / Cat 1+ equivalent). This is heavily weighted toward the SHEM, since January is off-season in the Northern Hemisphere (minimal to no activity).
For the SHEM specifically in January, activity peaks, but the number reaching Cat 2+ remains modest. Reliable basin-combined estimates suggest an average of approximately 1–2 cyclones per January reaching Cat 2 or higher (with many sources implying closer to ~1.5 on long-term averages when combining SW Indian, Australian, and South Pacific data).This aligns with patterns where >50% of overall intense activity concentrates in January–February, but individual monthly counts for higher categories are low due to the short timeframe and variability.
Major cyclones (Cat 3+) are even rarer in a single month, often 0–1 on average in January.
This is lower than the seasonal peak intensity months' full counts, as cyclones can form, intensify, and decay within or across months. Recent seasons show variability (e.g., some Januaries with 2–3 Cat 2+, others with 0–1), influenced by ENSO and other factors, but the climatological mean holds in that range.For context on the broader SHEM season:Average named storms per full season: ~9–12 (varying by source and exact region definition).
Average hurricane-strength (Cat 1+): ~5–7.
Average major (Cat 3+): ~2–3.
January contributes significantly to these totals but not overwhelmingly for the higher categories. If you're looking for a specific basin (e.g., Australian only) or a particular dataset/time period, more details could refine this further.
55
2026 ZODOC FORECAST #1
USA WINTER STORMS
GENERALLY FOR THE USA, BUT THESE LOCATIONS ARE SPECULATIVE.
THESE STORMS SHOULD BE WHAT THE WEATHER SERVICES, LIKE ACCUWEATHER AND THE WEATHER CHANNEL, WILL BE REPORTING ON.
JANUARY AND FEBRUARY: HEAVY SNOWSTORMS MID JANUARY FOLLOWED BY FREEZING TEMPS AND ICE
POSTED 12/5/2025
1/03 > FRIGID AIR MIXES WITH MOISTURE = LIGHT
FLUFFY SNOWSTORM IN THE EAST
1/04 - 1/09 > ABOVE AVERAGE TEMPS, WARM & DRY
IN THE EAST
1/09 - 1/11 > HEAVY RAINS AND FLOODING, WEST AND
MID-WEST
1/13 - 1/16 > HEAVY WET SNOW AND RAIN
1/16 - 1/25 > SNOWMEGGEDON
1/16 -1/19 > HEAVY WET SNOW
1/19-1/25 > FREEZING SNOW AND ICE
1/26 - 1/29 > FREEZING, SUPER FRIGID AIR MASS
MOVES IN
1/30 - 1/31 > ICE STORMS
2/06 – 2/08 > ICE STORMS
2/09 – 2/11 > ICE STORMS
2/11 – 2/14 > ICE STORMS AND SNOW

5
2
275
@AstroWeather2
's December 2025 post delivers an astrological timeline forecast for U.S. winter storms in January-February 2026, highlighting events like light East Coast snow on January 3, warm conditions through January 9, heavy Midwest rains January 9-11, and a "Snowmageddon" of heavy snow and ice January 16-25.
Updates from the author through January 23, 2026, and NWS/NOAA reports confirm strong alignments, including 1-9 inches of fluffy Northeast snow on January 3, above-normal East temperatures January 4-9, severe flooding storms January 8-10, and a deadly major winter storm January 24-25 with widespread heavy snow, sleet, and ice across North America.
Though striking matches fuel interest in the astrologer's unverified planetary-stress paradigm, peer-reviewed studies in journals like the Journal of Geophysical Research link such weather to natural drivers like polar vortex disruptions, dismissing astrological influences as correlative rather than causal.
61
The Zodoc Tropical Cyclone Timing Experiment (2025)
Overview
This project documents an exploratory long-range tropical cyclone (TC) timing experiment conducted during the 2025 Northern Hemisphere season (Aug 15–Nov 30). A small number of calendar-based timing windows were issued prospectively—weeks to months in advance—indicating periods of elevated interest for TC genesis and rapid intensification (RI) onset.
Forecasts were posted once and not updated. While some posts mentioned basins or regions, the verification here is timing-only and basin-agnostic, reflecting the stated limits of the model.
What was tested
Two event types were evaluated:
Genesis timing: the calendar date on which a tropical cyclone first formed
RI onset timing: the first day on which a storm met rapid intensification criteria
The question tested was simple:
Do TC genesis and RI onsets occur within the forecast timing windows more often than expected by chance, given when those windows were issued?
Why this differs from operational forecasting
Operational agencies such as the National Hurricane Center (NHC) focus on short-range, conditional forecasting:
Genesis probabilities are issued for existing disturbances over days, not months
RI guidance applies once a storm already exists
Forecasts are updated frequently (often every 6 hours)
By contrast, this experiment evaluates unconditional, long-range calendar timing, issued once, without updates. The two approaches are not directly comparable and are evaluated using different skill frameworks.
In other words, rather than just a hits/miss's probability, these statistics take into account the long-range lead time of the forecast window.
Results (Aug 15–Nov 30, 2025)
Genesis timing
Prospective storms evaluated: 32
Hits inside forecast windows: 30
Expected by chance (post-date conditioned): ~6.8
Exact probability: p ≈ 1.5 × 10⁻¹⁹
Median lead time: 12 days (max 37 days)
RI onset timing
Prospective RI events: 12
Hits inside RI windows: 7
Expected by chance: ~1.1
Exact probability: p ≈ 5.9 × 10⁻⁶
Median lead time: 14 days
Both genesis and RI events clustered inside forecast windows far more often than expected under a timing-only random null.
Interpretation
These results suggest that the timing windows captured real structure in the seasonal evolution of TC activity, particularly for RI onset, even when evaluated under a conservative, prospective framework that accounts for lead time.
This does not imply deterministic forecasting skill, nor does it replace operational guidance. Rather, it indicates that calendar timing signals may contain information relevant to long-range TC activity that merits further multi-season testing.
Caveats
Single season (2025)
Exploratory, timing-only analysis
Basin/location skill not evaluated
No claim of operational readiness
Replication across multiple seasons is required before drawing broader conclusions.
93