




A break below the 200 will send shock waves around the world.
On a trading view chart. Out on the 200 Day. If you see the candle drop below it, re-test the 200 Day and fail. This indicates the S&P 500 is going much lower. Stock prices will plummet.

95

Located a rather unusual trend.
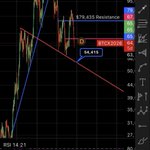
If $54k hits! That’s maxed out fear and the shit posts will be annoying AF.

2
1
191
Leveraged traders are running around without a clue of what to do.
The whales are hunting the shrimp now.
At the 54k mark that’s when everyone could give up.
At this point the whales would be in full control. As seen in prior bear markets.
I’ve got a song for the leveraged traders.
Martha Reeves (nowhere to run) youtu.be/RQRIOKvR2WM?is=aXrH…
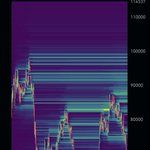
The heat map will move by the hour or minute now.
TA becomes rudimentary: Fib retracement, liquidity, ETF inflows/outflows (Black Rock).
Leveraged traders have entered Elden Ring mode or trying to play Super Mario blind.


43

FUCK $40K. The bears have it wrong!
I hope someone bought Bitcoin at 68K. The support level is becoming stronger.


Take a look at Celsius and Elf. In the sell off both stocks remain resilient and are trending up.
97


