

Funded Forex Trader & Educator | Breaking Down Forex From Scratch.📊 Master Fewer Pairs. Build Market Dominance.🧘♂️
Trading view
Joined February 2024
- Tweets20.9K
- Following468
- Followers2K
- Likes71.5K






Pinned Tweet
I’m about to take you through Forex from the ground up — from how the market actually works, to market structure, liquidity, execution, risk management, and eventually the exact SMC strategy I trade.
No shortcuts. No surface-level knowledge. Just the full stack.
The next post starts the journey. Stay close. 👀


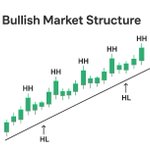
2. Downtrend (Bearish Market)
A downtrend occurs when price consistently creates Lower Highs (LH) and Lower Lows (LL). It shows that sellers are generally in control.

1
4


3. Low (L)
The Low is the lowest price reached by the candlestick during its formation.
It represents the lowest point the market reached before that candle closed.
4. Close (C)
The Close is the final price at which the candlestick ends when its timeframe expires.
It tells us where the market finished within that period.
1
3
26
Important things to understand
1. When Close is above Open, the candle is bullish.
2. When Close is below Open, the candle is bearish.
3. The High and Low determine the full price range of the candle.
4. The candle body represents the distance between Open and Close, while the wicks show the price movement beyond those levels.
3
22

3. Difference Between Bullish and Bearish Candlesticks
Bullish. Bearish.
Buyers dominate .Sellers dominate
Price closes higher.Price closes
Lower.
Usually green or white. Usually red or
Black.
Indicates upward.Indicates
Downward
Movement.
1
1
5
4. Important Things to Understand
As a trader, remember these three things:
1. A bullish candle does not automatically mean the market will continue going up.
2. A bearish candle does not automatically mean the market will continue going down.
3. Always consider market structure, trend, liquidity and the location where the candlestick forms.
Key takeaway: Bullish candlesticks show buying pressure, while bearish candlesticks show selling pressure. Understanding the difference is one of the foundations of reading price charts.
2
7

4. The Four Important Price Points
Every candlestick has four important price points, commonly called OHLC:
Term Meaning
O – Open:Price at which the candle
Started.
H – High:Highest price reached.
L – Low: Lowest price reached
C – Close:Price at which the candle
ended.
1
1
13
5. What the Anatomy Tells a Trader
Understanding candlestick anatomy helps you interpret the battle between buyers and sellers.
- Large body: Strong price movement in one direction.
- Small body: Limited movement between opening and closing prices.
- Long upper wick: Rejection of higher prices.
- Long lower wick: Rejection of lower prices.
- Small wicks: Price closed relatively close to its extreme.
1
9