

Full-time crypto trader & investor since 2017
Joined November 2020
- Tweets4.7K
- Following470
- Followers34.4K
- Likes10.4K


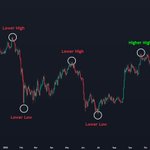


In 2018 and 2022, $BTC got a big red November candle before its bottom was confirmed

$BTC was at cycle lows every time the Power Law Decay Channel Oscillator reached these levels


$BTC only had more than 2 consecutive green months after the bear market bottom was in during previous cycles

$BTC trading at an important volume support
Live on YT right now: youtube.com/live/IoGhy_WJS7M

$BTC had already formed its bear market bottom the last time the 50 MA crossed above the 100 MA on the 3D chart


$BTC weekly RSI broke above a trendline that had held for over 2 years and is now retesting it

$BTC has dropped after every past US midterm election
The next one is tomorrow


Really bad if $BTC breaks this
That's my plan: youtube.com/live/ZVpQSVr-9Tk


$BTC currently has over 6x more liquidations above than below
$15,500,000,000 in short liquidations to the upside
$2,440,000,000 in long liquidations to the downside

