

Publishing Black Data since 2007. The #1 premier reference for Black/African American Statistics
United States
Joined May 2016
- Tweets14.4K
- Following3.4K
- Followers1.9K
- Likes315






Pinned Tweet
Black Americans remain overwhelmingly Christian, but the religious landscape is changing.
• 76% identify with a Christian tradition
• 24% are religiously unaffiliated (“Nones”)
Baptists remain the largest religious group at 32% of Black adults.

Do you have a relative over 100 years old?

Interesting! 44% of the oldest living Americans are Black women!
According to Wikipedia, of the 50 oldest living people in the world, nine are Americans, and four of those nine are Black women. All four were born in the South: Georgia, Tennessee, Arkansas, and North Carolina.
That’s 44%!
1
131
Teen birth rates, 2000–2024:
Black: 79.2 → 17.7 (↓78%)
Nationwide: 47.7 → 12.6 (↓74%)
Has the public’s picture caught up?
CDC: births per 1,000 females ages 15–19; Black = non-Hispanic.
Support our work:
blackdemographics.com/suppor…

About 96% of Black-owned businesses had no paid employees in 2023. Owners and contractors can still earn income.
What may help more owners hire?
Support more BlackDemographics charts:
blackdemographics.com/suppor…

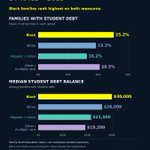
About 1 in 4 Black families had student debt in 2025. Among those with debt, the median balance was $30,000, highest on both measures among the groups shown.
Source: Federal Reserve, 2025 SCF.
Support our work:
blackdemographics.com/be-a-s…

Median family wealth changes, 2022–2025:
🟡 Black: −25.1%
🔵 White: +6.5%
🟢 Hispanic/Latino: +18.1%
All U.S. families: +2.3%
While White and Hispanic median wealth grew, Black median wealth fell by one-quarter.
Support our work:
blackdemographics.com/be-a-s…

Learn more about Black wealth:
blackdemographics.com/black-…

Black median wealth fell in four straight survey periods from 2001 to 2013.
It rose 60.5% in 2019–2022, then fell 25.1% in 2022–2025—the second-largest decline between surveys since 1989.
Support our work:
blackdemographics.com/be-a-s…

Learn more about Black wealth:
blackdemographics.com/black-…
2
180
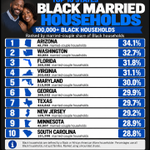
1/6 🧵 Arizona leads: 34.1% of Black households are married-couple households.
Top 10 among states with 100,000+ Black households. Continue for rankings 11–30. 👇🏾
Support independent Black data:
blackdemographics.com/suppor…

5/6 🧵 The final five qualifying states:
Missouri: 21.3%
Pennsylvania: 21.2%
Illinois: 21.1%
Michigan: 20.4%
Wisconsin: 15.9%
All 30 meet the 100,000-household minimum. Definition and source next 👇🏾
1
1
136
6/6 🧵 “Black households” means the householder is Black alone. A spouse may be any race.
These are shares of households, not percentages of Black adults who are married.
Source: 2024 ACS 1-Year, B11001B.
data.census.gov/table/ACSDT1…
1
103
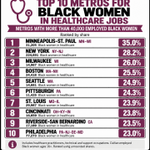
More than 1 in 3 employed Black women in Minneapolis–St. Paul work in healthcare occupations: 35%, or 31,205 women.
That includes practitioners, technicians and support workers, such as nurses and nursing assistants.
Top 10 below. Extended top 48 ranking in replies. 👇🏾

Source: 2024 ACS 1-Year, Table B24010B. Black Alone, civilian employed women ages 16+.
Includes healthcare practitioner, technical and support occupations. Metros must have more than 40,000 employed Black women. Rankings use unrounded shares, not pay or job openings.
1
26
