
Bias-checked Elliott Wave counts, using momentum tools (RSI, Stochastics) and other technical indicators. Futures trader.
Joined October 2023
- Tweets657
- Following337
- Followers113
- Likes221


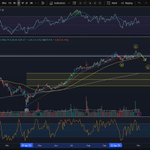

My prediction about NVDA having made a bottom was correct but for only 1-2 days for the rebound. There is no indication that the drop is done---That was my bias. That rebound could just last for 1 or 2 days before resuming the downtrend, which is the case now.
21

I expect at least a rebound or rally from here (coinciding with earnings next week), perhaps not immediately to ATH, but at least make a right shoulder and then drop again to retest the Huang resignation bottom.
12
Bwater Wave retweeted

I am WARNING you now.
This is the START of the chop until October 2026 timing cycle.
My calculations show that ~62% of traders will LOSE money until October 2026.
Not because markets will be WEAK, but a combination of over-trading and trying to find rotations.
Traders are trying to OUTSMART the markets. Don't.
The best thing to do is STAY in your winners.
Let your winners CONTINUE to uptrend.
You can trim 20% - 30%, but do NOT sell fully.
What to do?
1. Balance with AI infrastructure and financials, healthcare, utilities until October 2026.
2. Mag 7's are showing weakness, make sure you have other parts of the AI trade in your books (power, memory, gpu's, optics, etc.)
3. Biotech and financials gaining strength
4. $MSFT, $PLTR, $NFLX and other software very weak; size appropriately. Can hold, but if you hold, I wouldn't make it my top allocation in my portfolio.
Peak-to-trough drawdown:
• March 2026: ~-6.4%; first real ugly month - VIX spiked hard
• April 2026: ~-9.6%; very choppy recovery - big dip early, then strong rally
• May 2026: ~-4.6%; decent but still had a solid pullback
• June 2026: ~-5.0% (so far); already down ~5% from early June high
I will make sure you SURVIVE until October of 2026.
Until then, stay in uptrending industries. Cut your losers.
It's going to be a very CHOPPY ride.
Expect red, green, red, green, red, green, constantly.


Bwater Wave retweeted

There's something that happens between 2:00-5:00 AM every single day that creates millionaires while most people are sleeping…
By the time you wake up, the money has already been made. Here's how to catch it.
The London Judas Swing:
London traders open at 2:00-3:00 AM EST. The Asian session has created a range overnight.
Here's what happens almost every day:
1) London opens and pushes price in one direction (usually toward the nearest liquidity pool)
2) This move takes out Asian session stops and creates FOMO
3) Price sweeps the high or low of the overnight range
4) Price REVERSES and goes the opposite direction for the rest of the day
The "Judas" is the fake move. It looks real. It triggers retail traders. Then it completely reverses.
Why this works:
London needs to accumulate positions for the day. They use the thin liquidity of early morning to push price, grab stops, fill orders, then reverse.
By the time New York opens at 9:30 AM, the real direction is already decided. NY just continues what London started after the Judas.
How I trade it:
2:00 AM: Mark the overnight range (Asian session high/low)
3:00-6:00 AM: Watch for price to aggressively sweep one side of the range
8:00-10:00 AM: Look for reversal signature into a fair value gap
Enter with stop behind the gap, target the opposite side of the overnight range (minimum), or the next significant level beyond.
By 10:00 AM, I'm usually already in profit or stopped out.
Most of my winners are over by 11:00 AM. The market already told you what it wants to do while most US traders were sleeping.
The early bird doesn't get the worm. The early bird BECOMES the worm that catches the late traders who missed the real move.
Knowing how to profile your previous sessions for NY will bring your win-rate by 20%.
(I teach trading methods that made over $3m total. Anyone can join my trading GC for free with the link in my bio)
Bwater Wave retweeted

I haven’t had a serious drawdown since the 1980s—just a few single-digit down years in over three decades. How? A deep respect for risk and unconditional patience.
A few key rules:
1. Always cut losses short - no big losses. no exceptions!
2. Only trade large on the heels of smaller trades working
3. Always trade progressively smaller when
trades aren't working
4. Never average down
5. Never let a good-size gain turn into a loss
6. No forced trades - no style drift



#Bitocin $BTCUSD most likely bottomed on Nov 17, 2025.
1. The correction was a 3-wave (W)(X)(Y) move correcting the entire rally from 2022 Nov (you have to look at the weekly). This is called a "running flat" because it is a 3-3-3 correction with the (X) wave making an ATH and (Y) wave stopping above the origin of (W), showing strong buying.
2. Price turned at a confluence zone: (W)(X)(Y) hitting at 1.618 fib + the 3-wave (Y) also hitting at 1 fib + Daily order block (bottomed ticked!)
3. Capitulatory price action at the bottom with price accelerating vertically to the downside falling out of the yellow channel (daily chart), and overshooting the grey channel (weekly chart) + highest daily volume
4. Momentum on all levels has been reset.

103
I am watching btcusd and Russell as leading indicators for trend change because they have fallen so much, they must outrun spx in the bounce. This is exactly what happened on Friday. Tickers like $Amd and $Tsla have reached their extreme critical support areas meaning they just cannot go any further down. More downside would completely break their charts showing years of downfall which is very unlikely.
118
Haven't posted in a while. Whenever I had a big profit day (>25%), the direction changes the day after. Thursday I had the biggest day of my trading journey (91%) trading the overnight rally up the Nvidia earnings and changed to shorts when the M top fails at the opening, and Friday the trend indeed changed. Gave back a big part of that profit. Another lesson learnt. Many technical and sentiment indicators showing a rally is coming and most likely on friday we marked the bottom of this complex 3-wave drop.
39
$BTCUSD #Bitcoin (Nov 17): I make a call that #Bitcoin and #crypto bottomed today on Nov 17. As you see on the Weekly, Bitcoin has been doing a running flat (WXY) from Dec 2024 to correct the weekly cycle. the last leg ended at Fib 0.618.
Meanwhile, equities #SPX #NQ #QQQ bottomed on Friday. We will have the melt-up wave 3 of 3 rally Monday onwards!

65
📈 $QQQ $IWM (Nov 9 weekend update): index are nesting to the upside with the melt-up wave 3 of (3) starting next week. Signs I see:
1. QQQ price bounced off 50 EMA and closed high with strong volume.
2. Weekly RSI has broken above previous pivot, showing strong momentum. If it were end-stage wave five, it would have shown bearish divergence.
3. IWM chart: price was just testing the key 2024 high. Two sets of wave 2 are clearly seen off the april's low. It's a 12, 12 wave nesting to the upside instead of 1234 wave since April's low because the last high didn't make a higher high in RSI (wave 3 would have made a higher high).
4. The QQQ/SPY chart shows no divergence, which means QQQ is leading and outperforming SPY.
5. Risk-on assets like #Bitcoin stopped dropping and is holding its critical 100K level (also 50 weekly EMA). Bitcoin is making another wave 2, nesting to the upside also.
6. Tech was holding (despite last week's breakdown), while other defensive sectors reset to cause breadth to deteriorate and reset sentiments.
7. If we get a follow-through to the upside on Monday, it confirms this bullish count to the upside.
$NDX $SPX $SPY #Elliottwave #bullish

1
61

$SOFI (Nov 5): Sold off as warned yesterday. The April rally has ended. It can drop to at least 18, or even 14.

This quoted post is unavailable.
1
99
📉 $QQQ (Nov 4): Most probably, the top for the April rally is in.
1. Market gap down overnight and the gap is maintained today intraday.
2. Stochastics show that possibly we are not only correcting the October cycle but also the April cycle.
3. Risk assets like bitcoin is below 200 MA daily and even 50 EMA weekly. Some sectors, like XLU, XLP, XLC are also below the 200 MA.
4. The gap up in Nasdaq futures last Monday (Oct 27) at the open was most likely an exhaustion gap (not acceleration gap) in the final wave.
5. SPX is close to the 7000 resistance level
Other things that add to the bearishness for risk assets are:
1. DXY has bottomed
2. TNX is building a bull flag that seems to rally higher. FED may stop reducing rates, maybe even increase rates
3. Wheat and Corn futures have finished a year-long correction and seem to start to begin to rally - meaning inflation may happen soon?

69