

We post real charts with the ending hidden. You call it. The app: hidden-chart rounds, bar-by-bar backtesting, and an AI read of how you trade.
Joined September 2026
- Tweets286
- Following113
- Followers16
- Likes116




Pinned Tweet
Most traders find out their strategy doesn’t work after it’s cost them real money.
There’s a cheaper way.
Candle Arena: real market history with the ticker hidden, and a backtester for 500 US stocks, candle by candle. Free to start 👇
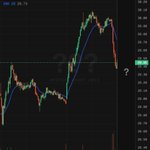
#014 was $LYB, 20 Mar 2013.
It looked set to go up. It didn't.
Next 89 minutes: ended −0.32%, highest 0.00%, lowest −0.88%.
The Opening Range Breakout on $AAPL over 3 years: 689 trades, only a 35% win rate. Average result before fees: a tiny +0.03R. Commissions and slippage of 0.03R a trade eat all of it. Stop guessing your edge. Run the data yourself, candle by candle.
This is where FOMO writes checks your account can't cash.
Mystery stock, 2013 (5-Minute Chart)
Do you buy, sell or stand?

#013 was $M, 18 Apr 2018.
It went the way the chart pointed: down.
Next 85 minutes: ended −0.32%, highest 0.00%, lowest −1.65%.

Only 1.1% of day traders who kept at it for 300 days earned more than minimum wage.
Mystery stock, 2018 (5-Minute Chart)
Do you buy, sell or stand?

You're not losing money to the market.
You're losing it to five habits you'd swear you don't have.
This video shows them one by one, each on a real day replayed in Candle Arena: chasing a spike, sizing too big, revenge trading, moving the stop, trading too much. Wrong first, then right.
Stop paying the live market to teach you basic discipline. Get your reps in.
Get your reps in: candlearena.app/?utm_source=…

#012 was $T, 29 Apr 2015.
It looked set to go up. It didn't.
Next 75 minutes: ended −0.82%, highest +0.06%, lowest −1.02%.

Hesitate and you chase. Rush and you're someone's exit liquidity.
Mystery stock, 2015 (5-Minute Chart)
Do you buy, sell or stand?

#011 was $GAP, 25 Mar 2021.
It went nowhere worth trading.
Next 45 minutes: ended −0.09%, highest +0.64%, lowest −0.57%.
On this day in 2021, $NVDA jumped 12.1% in a single session.
Anyone remember why?

Right here is where people move their stop and pray.
Mystery stock, 2021 (5-Minute Chart)
Do you buy, sell or stand?

Small accounts don't die from one bad pick.
They die from one trade that was way too big, held too long, then doubled to win it back.
This video gives the five rules that keep a small account alive, then proves them: a full month of real Nvidia history traded in one sitting on Candle Arena. 19 trades, 11 losses, and never more than about 2% down.
Stop paying the live market to teach you basic discipline. Get your reps in.
Get your reps in: candlearena.app/?utm_source=…
#010 was $FE, 5 Jun 2026.
It went the way the chart pointed: up.
Next 149 minutes: ended +0.19%, highest +0.87%, lowest −0.22%.
On 4162 days since 2010, $NVDA's first hour went one way or the other.
The day closed the same way 3127 times. That's 75%.

Your plan says wait. Your gut says now.
Mystery stock, 2026 (15-Minute Chart)
Do you buy, sell or stand?

the last 8 times apple beat, the stock fell the next day 6 times. beating is the part everyone already expected xitter.gq/StockMKTNewz/status/21…

Apple $AAPL reports earnings today after the stock markets close
You should expect the numbers to come out at 4:30PM ET followed by the earnings call at 5PM ET
