

No signals. No calls. No "trust me bro". Just charts - explained.
- Tweets287
- Following549
- Followers99
- Likes6.2K






ALT A hammer with a small lower wick is not a hammer. The lower wick must be at least twice the body. The upper wick should be almost nothing. The body sits at the top of the candle's range. That shape means one thing: price got pushed down and closed back up. Sellers had control for most of the candle. They lost it by the close. Same shape after an uptrend is a hanging man. Not a hammer. The drawing is identical. Only the location changes the meaning. Where I wasted money: hammers in mid-air. A hammer that rejects nothing is just a candle with a long wick. It needs a level you marked before the candle formed. If the next candle closes below the hammer's low, the idea is dead. How many long lower wicks on your $BTC chart are actually at a level?

ALT Same shape. The name changes with what came before it. Lower wick at least twice the body. Upper wick almost nothing. Body at the top of the range. That is one candle. It has two names. After a fall in price: hammer. After a rise in price: hanging man. Green or red body does not decide it. The trend before it does. Why the hanging man matters: Sellers pushed price down hard inside an uptrend. Buyers won it back, but the dip is new information. Where I got it wrong for a long time: I named the candle first, then looked at the trend. Do it the other way. Trend first, name second. Both die the same way. If the next candle closes below the wick's low, the idea is dead. Honest: the hanging man is the weaker of the two. Many traders ignore it. Check your $BTC chart — trend first, then name it.

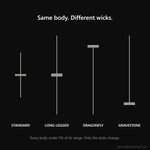
ALT A dragonfly and a gravestone are the same candle upside down. Both are a tie. Buyers and sellers finished level. The difference is where price got rejected. Dragonfly: long lower wick, body sits at the top. Sellers pushed down and lost it all back. Gravestone: long upper wick, body sits at the bottom. Buyers pushed up and gave it all back. Test before you call it either one: Body under 5% of the full range. One wick at least 75% of the range. The other wick close to nothing. If both wicks are long, it is a spinning top. Not this. Where they matter: at a level you marked before the candle formed. Mid-range, both are noise. I traded them there for months and paid for it. If the next candle closes back through the long wick, the idea is dead. Which one shows up more on your $BTC chart?

ALT All four dojis share the same body. The wicks separate them. Body under 5% of the high-to-low range. That is what makes it a doji. Standard: short wicks, both sides similar. Long-legged: both wicks long and similar. Price ran far both ways and settled in the middle. Dragonfly: body at the top, long lower wick, no upper wick. Gravestone: body at the bottom, long upper wick, no lower wick. Common mistake: calling dragonfly bullish anywhere on the chart. After a long fall it means something. Inside a range it means nothing. Decision rule: mark the doji high and low. Act only on a close outside one of them. On low volume all four are just thin trading. Compare volume to the last 20 candles. Which of the four shows up most on your $BTC chart?

ALT A doji is not a reversal signal. It is a tie. Open and close finish at almost the same price. Rule: body under 5% of the high-to-low range. Bigger than that, it is a small candle, not a doji. A tie means nothing on its own. A tie after a long run means something. In sideways chop, a doji is one of twenty. At the top of a long run, it is buyers running out of size. Common mistake: entering on the doji close. The doji has no direction. You are guessing which way the tie breaks. Decision rule: mark the doji high and low. Trade only when the next candle closes outside one of them. On low volume, a doji is just nobody trading. Compare volume to the last 20 candles before you read anything into it. Where do you see most of your dojis on $BTC — trend or chop?

ALT A big green candle is not a marubozu. Marubozu means no wicks. The body is the whole candle. Rule: body at least 90% of the high-to-low range. If the upper wick is long, sellers pushed back at the top. That is not control. A spinning top is the opposite. Small body, long wicks both sides. Rule: body under one third of the range, and both wicks longer than the body. One says a side owned the session. The other says nobody did. What it costs: people buy the top of a fake marubozu, expecting more. Decision rule: after a marubozu, if the next candle closes back inside its body, the push is finished. Where this stops working: a spinning top inside sideways chop is noise. It only carries weight after a strong run. Check the wicks before you name the candle. Which one shows up more on your $BTC chart?

ALT A lower wick is not proof buyers won. It proves sellers pushed down and someone pushed back. Here is the check I run on $BTC. 1. The lower wick is at least twice the body. Measure it. A short wick is just noise. 2. The wick drops below a level that existed before this candle. Old low, prior range floor, [VERIFY: exact level on your chart]. 3. Volume is higher than the last 20 candles. Buying that matters shows up in volume. The mistake that costs money: buying the wick while price still makes lower highs. One candle does not turn a downtrend. My exit rule: if the next candle closes below the wick's low, the idea is dead. Honest limit: the wick shows buyers appeared there. It does not show they will stay. How many candles do you wait after a lower wick?

ALT Marubozu means shaved head. No wick at all. On $BTC you will almost never see a clean one. So people call any big body a marubozu. That is where it breaks. My cut-off: the body must be at least 95% of the full range. Measure high to low. That is the range. Both wicks together under 5%, or it is just a strong candle. A true marubozu means price never traded back against the move. An almost-marubozu means it did, briefly. Someone pushed back. The mistake: calling a 70% body a marubozu and sizing up on it. A 70% body is a normal trend candle. Nothing rare about it. Honest limit: a marubozu on a 1-minute chart in a dead hour is not control. It is nobody trading. Check volume before you call it strength. What is your cut-off? 90% or 95%?

ALT A long upper wick alone tells you nothing. It only means something at a level you marked first. Here is the check I run on $BTC. 1. The upper wick is at least twice the body. Measure it. Do not eyeball a close call. 2. The wick pokes above a level that existed before this candle. Old high, prior range top, [VERIFY: exact level on your chart]. 3. Volume is higher than the last 20 candles. Rejection needs sellers. No volume, no seller. The mistake that costs money: trading a wick in the middle of a range. Middle of range has nothing to reject from. My exit rule: if the next candle closes above the wick's high, the idea is dead. Honest limit: the wick tells you sellers showed up. It does not tell you how far price drops. What level are you watching on $BTC right now?

ALT CHECKABLE CRITERION — wick at least twice the body; level marked before the candle; wick ÷ body logged across 50 samples. CONTRAST — light-volume thin book vs heavy-volume absorption, same shape. CONTRAST — wick at a marked level vs wick mid-range. DECISION RULE — next candle closes above the wick tip, the rejection failed; that tip is the level where I am wrong. COMMON MISTAKE — drawing the level after seeing the wick, fitted to the answer. HONEST LIMIT — the candle never shows who traded; section 6 says the stop-hunt story is oversold and uncheckable.

ALT CHECKABLE CRITERION — wick at least twice the body; wick sits at the edge of a 20-candle range. CONTRAST — same wick at the range edge vs the same wick mid-range. COMMON MISTAKE — trading wicks with no location filter, named as my own. DECISION RULE — next candle closes past the wick tip, the rejection failed. HONEST LIMIT — thin markets print wicks from bad fills, not real pressure.