

Reaching financial freedom … one chart at a time 📈🌱 NFA
California, USA
Joined July 2025
- Tweets4.8K
- Following463
- Followers6.6K
- Likes10.7K


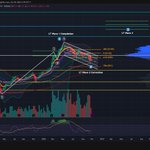


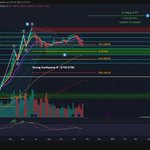
Take a well deserved break this weekend.
Price action early next week is essential to understand how to move forward.
No point in staring at your screens as the market stays in limbo and there is no decisive outcome foreseeable at this time.
$QQQ just reached my initial target for a potential low during this correction.
This is the .786 Fib ($683) for a Higher Low off the July bottom. A hair above the UTL since April 2025 and the Daily 200MA.
Holding $680+ will be crucial, otherwise we may rapidly see $660s due to elevated volatility early next week.
Based on my findings thus far, I cross my fingers we bleed into next week and can easily time a Major Low then. Small odds of it happening today, but I am not confident in the idea at all. Would much rather see us correct further for a V-shaped recovery setup.

This is the move I’ve been warning of since early September.
In the post below, I even called the market a “ticking time bomb”. Today it blew up.
It’s a shame though. I expected this correction to be a sustained move rather than a Flash Crash. That said, these moves can end rapidly so stay on your toes.
My gut tells me not to add anything today. This can easily blow over into next week as markets enter a fragile territory of elevated volatility.

Still waiting 😴
The delay discussed is obviously taking place. It makes sense considering oscillator, stocks-above, and bullish-% data points were all stretched too low due to breadth deterioration.
It has been a very odd dynamic the past couple weeks, but not entirely unreasonable. Everything makes sense. I find that the upside taking place right now is reminiscent of October 2025.
Pain is seemingly around the corner in the oncoming $7860-$8020 range on $SPX $ES_F. Perhaps even at current prices. I’ve seen several trusted sources speculate that next week could see the market regime flip towards bearish. I agree due to my findings that we may observing a ticking time bomb.
Guess it was a wise choice to not invest in any position aside from $CLS over the past week. The constant push and pull would be nauseating if I was any more exposed.
I’d prefer the market keep it simple rather than grating retail down bit by bit, but that is the name of the game. I've been able to anticipate these pops of relief, but each carries uncertainty as ideal signs of a Major Low haven't been firing off the Local Lows. Below are the levels I am monitoring now on the S&P and NASDAQ.
If $QQQ fails to hold $700, I would expect a corrective leg down towards $660-$685. The higher end of the range seeming more probable as it shares the confluence of the .786 Fib off July Lows + Daily 200MA + Log UT Trendline respected since April 2025.
As for $ES_F $SPX, I am looking towards $7220-$7510 as the range to monitor in the event it also confirms a breakdown.
It is difficult to pinpoint the exact level for a low. It is easier to time it with data and indicators, so in the event of a breakdown, I will simply monitor those and report back when I expect we near the appropriate time for a Major Low.
Be brilliant all you want, but if you lack kindness and character, none of it matters. The human mind and body is fragile so treat it with respect.
Leading with hatred and harboring the capacity to inflict pain on the undeserving is a disease all too common now that society is shifting away from a sense of community and interdependency to independence.
Social media rewards arrogance, ego, and attention-seeking behavior. In the worst of people, it amplifies their wicked nature. But, as with anything, time reveals all.
Surround yourself with a sanctuary of peace, both in-person and online, as the World changes rapidly. Groups, family, friends that bring the best out of you, emphasize enjoying life if you have that privilege, and focusing on issues in YOUR control.
Human beings were never meant to shoulder the burden that is the knowledge of all the World’s plights. We were simply built to take care of the ones in front of us. By all means, go out and change the World if you want to, but choose your battles wisely and be sure that it is truly fulfilling.
Now I am just rambling. You reap what you sow. Become the best version of yourself no matter how hard it is. Choose to interact with those worthy of your energy. Blah blah blah.
$GOOG $GOOGL
Quite the surprise. This double miss from Google comes as Semiconductors may take leadership back from the Magnificent 7 in the technology sector in the weeks or months ahead.
Structurally, the stock was already primed for this move as it put in its Wave 3 Major Top in May and is already within its Wave 4 correction. This ER simply confirms this technical outlook, enforcing a breakdown from the Log UT Channel respected since April 2025. The scariest part is how tight the Bollinger Bands are on the Weekly at this time, meaning downside momentum may become very vicious on $GOOG $GOOGL in the weeks to come as it squeezes lower. Perhaps the 1.618 Log Fib S&R + Weekly 100MA ($265) can provide support though.
I am unsure where the bottom will be for Wave 4, but I would not touch this stock for the time being. Far greater opportunities out there while the dust settles here. It'll have its time in the Sun eventually, but not anytime soon after this report. The company needs to earn back goodwill from investors.


$AAOI
One of the more frustrating stocks to chart in recent memory, but it's hardly surprising given the euphoria that surrounded the name months ago due to relentless bull-posting.
Fundamentally, I remain skeptical that the company can deliver on the explosive growth expectations currently previously priced in. The projections strike me as overly ambitious, perhaps even unrealistic from where they currently stand. I question whether the company will have the balance sheet to enforce such a parabolic rise in EPS/Revenue? Management is opaque in my opinion and repeat dilution may be necessary. At this point, I much prefer $COHR over $AAOI, but the technical setup is still worth discussing.
Following a premature termination of Primary Wave 5, $AAOI established a Major Top in early May, initiating the LT Wave 2 correction that has since erased roughly -70% of its value from ATHs. At present, the stock is attempting to establish support at the confluence of its Weekly Lower Bollinger Band, Bi-Daily 200MA, and Daily BOB, all while entering the Golden Pocket of its LT Wave 2 retracement between the .618 + .786 Fibs. Thus, this is a technically significant region where buyers may begin stepping in more aggressively, although support alone is hardly sufficient to confirm a durable bottom. Company execution is necessary to revert a Falling Knife.
A convincing reversal would require a breakout from its Log DT Channel, followed by a Base Breakout above horizontal resistance in the mid-$100s. Complicating matters is the substantial Volume POC @ $95–$115, which acts as overhead supply and may repeatedly suppress recovery attempts. An exceptional ER next week could certainly shift sentiment and help overcome these obstacles, but that remains to be seen.
Should $AAOI fail to reclaim Key Levels and present a poor report, alongside $COHR + $LITE correcting further themselves over larger timeframes, I would not rule out an eventual decline into the $40–$50s region to complete LT Wave 2. For those invested or interested, I sincerely hope management kills it and the stock can recover. Otherwise $AAOI will remain vulnerable to prolonged consolidation or another leg lower.
Long-term, the incredible upside potential is undeniable, but only if the earnings growth suggested over the coming years is fact and achieved. LT Wave 3, for now, has a PT of $505+.


$INTC
Very interesting spot here for Intel heading into earnings tomorrow as Semiconductor stocks begin to turn up once more.
It has temporarily found support off its Daily 200MA retest and is skating within a swath of Daily BOBs as the Daily RSI reached oversold conditions with Bullish Divergence on lower timeframes that is now playing out. This is taking place within a relatively clean Log DT Channel during its anticipated Wave 4 correction. It has now held the mid-$80s a few times for a possible triple bottom.
It has corrected an adequate amount to support the idea of a breakout towards Wave 5, a move that has a PT of $180+. Tomorrow's ER will be crucial and dictate whether it wants to cut through consolidation and resistance above to initiate a breakout OR if it wants to correct further, opting to form a clean Bull Flag by breaking down to the bottom of the Log DT Channel depicted. Regardless, a solid swing opportunity is building up here.
No position myself. I'd prefer it in the $70s and do not mind if that does not occur. Can always follow up a breakout and confident higher low as needed.


$VRT
Vertiv delivered an impressive earnings report today, sending the stock soaring. A shame, considering this was a name on my radar for a potential relief rally with its clear RSI Bullish Divergence on the Daily. However, I refrained from confidently sharing the setup given the risk of another revenue miss, similar to its previous ER.
From a technical perspective, I believe $VRT remains within LT Wave 2 following its Major Top in May, leaving considerable room for downside across larger timeframes. This possibility is reinforced by its ongoing Log DT Channel and the much broader Log UT Channel it has respected since 2024.
Following today's explosive move, $VRT has now gapped up directly into a zone of resistance between $240–$270, where consolidation converges with the Weekly 20MA + 21EMA and upper boundary of its Log DT Channel. Coupled with the emergence of a potential Bearish Hammer Candlestick on the Daily, I suspect this rally may very well struggle to sustain itself. At the very least, a retracement to fill today's gap remains a likely outcome, which opens the door for lower lows if MMs desire it.
That said, there is no denying the strength of today's earnings report. I remain open to the possibility that $VRT defies these technical headwinds, breaks through overhead resistance, and attempts onset of LT Wave 3. Such a development opens the door to a PT of $690+ long-term. For now, however, I assign lower odds to this bullish scenario. The fundamentals have delivered, but the technicals still have something to prove.


$CLS
Chugging along smoothly and leading the market today. Even if the broader market decides against ATHs, enforcing a deeper correction, I find Celestica is now well insulated and has a solid probability of not re-visiting the recent local low.
You have to bite the bullet to enjoy that privilege. Glad I did with an open mind.
This is a ticker that others rarely discuss despite its promise. Oh well. The masses may very well pile in one day. It’s my most confident investment since $MU at $100, but it will not necessarily be as violent or volatile.
$CRDO 🟡 Relief or Recovery?
It is my view that Credo established a Major Top in June, marking the completion of LT Wave 1. Since then, the stock has been navigating a relatively clean Bull Flag formation through the ongoing LT Wave 2 correction. Retracement targets for LTW2 are illustrated in the images below.
Currently around its Volume POC, $CRDO has initiated a relatively strong relief rally off the confluence of support at the .5 Fib ($158), .618 Log Fib ($151), and Bi-Daily 200MA ($146). Interestingly, this setup bears a striking resemblance to the reversal off its March lows, when the stock developed Bi-Daily RSI Bullish Divergence within a similar Bull Flag structure before launching higher. Same exact situation here.
How far this relief rally can extend remains the critical question. The stock is now attempting to build momentum toward a potential breakout that could kickstart LT Wave 3, a move with a PT of $580+. However, that outcome is far from guaranteed. The recent Weekly 8/21 EMA Bearish Crossover remains a significant technical headwind, and any further deterioration in the broader market, particularly across IT and Semiconductors, could easily extinguish this recovery and drive $CRDO toward fresh corrective lows. Notable support zones remain in the low $100s should the correction deepen.
Much like the other charts I have shared today, the outcome will depend heavily on whether the broader market can convert its emerging relief rally into a sustained recovery toward ATHs, postponing a more severe macro correction. It is also entirely possible that $CRDO simply consolidates here while other names lead the recovery. You never know. For now, patience is warranted. The long-term opportunity remains compelling in my eyes, but the market has yet to confirm that the corrective phase is complete.


$GLW 🟡 Final Stand
Corning is currently navigating a Wave 4 correction. The technical picture looks increasingly bleak. That said, the stock is hanging on by a thread at the .886 Fib ($122), offering a final stand to establish a Higher Low relative to its July low, potentially kickstarting Wave 5. However, I am not confident in this outcome.
Following a solid ER today, there is certainly a fundamental case for renewed upside. However, whether the market is willing to provide the necessary liquidity to sustain that move will become clearer in the coming days and weeks. For now, there are a couple Key Levels to monitor: $122 // $113. Holding the latter could facilitate a Double Bottom formation to complete Wave 4, while losing it would favor an extended C-Wave correction, carving out fresh lower lows and potentially turning the stock into a falling knife.
Overhead resistance remains substantial, and $GLW has struggled to reverse the Weekly 8/21 EMA Bearish Crossover. A concentration of overhead supply exists between $125–$160, with additional resistance beyond that range. On the bright side, the Daily RSI is approaching oversold territory, suggesting a relief rally could be approaching, particularly as price sits within a cluster of Daily BOBs. However, any bounce could prove short-lived if buyers fail to reclaim critical resistance. Losing both Key Levels mentioned earlier would open the door to further downside toward the Weekly 100MA ($101) at the very least.
Ultimately, the near-term technical structure warrants caution, but the longer-term outlook remains promising. I continue to see substantial upside potential for $GLW, once the anticipated Wave 5 eventually materializes, a move that has a PT of $369. The question is no longer necessarily whether the stock has room to appreciate over the long term, but rather how much additional pain investors may need to endure before that next major advance begins.


$BE 🟡 PIVOT POINT
Bloom Energy currently sits at an inflection point, straddling the line between a breakdown that would confirm the onset of LT Wave 2 and an extension of the ongoing LT Wave 1 through one final breakout. The latter scenario would validate Minor Wave 5 of Primary Wave 5, completing the structure depicted in Image #1 below.
For now, $BE has successfully reclaimed its Log UT Channel following a temporary breakdown last week. However, this recovery must hold to support the case for a false breakdown rather than a warning of further downside. The stock has also lost its Daily/Weekly 8/21 EMAs, making their recovery and subsequent defense an immediate priority for bulls. Beyond that, significant overhead supply remains concentrated between $260–$290, presenting another obstacle aside from MAs. Until $BE can decisively break above this horizontal resistance for enforce a Base Breakout, it will be difficult to establish conviction in an imminent major move higher.
The Key Levels to monitor are $187 // $157. Ideally, $BE holds the former to establish a higher low here and preserve the bullish continuation structure for MW5 of PW5. Losing the latter would strongly suggest that LT Wave 1 has concluded and that the stock experienced LT Wave 2 onset in June, opening the door to a deeper correction than what has materialized thus far.
That said, there is considerable underlying support that should offer some reassurance even in the bearish scenario. In fact, $140–$160 remains my ideal range for a Major Low in the event of LT Wave 2 confirmation, implying relatively contained downside from the levels currently under consideration. However, investors should not mistake this support for an absolute floor. In the event of a broader market correction, it may extend its own correction as low as it wants to, even stretched as low as the $80s.
This is why distinguishing between a final impulsive advance and the onset of a prolonged corrective phase carries enormous implications. It's wise to couple findings with macro indices to time lows and highs. The bullish scenario remains alive for now, but the burden of proof is increasingly on buyers to reclaim lost momentum and confirm it.
All in all, I've shared both outcomes below. My bias leans towards Image #1 until further notice. But if unable to break to ATHs by the time the next major market correction rolls around, it would likely just amount to LT Wave 2 consolidation before activating a larger leg down on higher timeframes. It's a tricky situation to navigate. Regardless, long-term the company seems a gem and is executing incredibly well.


I rarely curse, but these fuckers really tried it today.
Shook out the masses with FUD-driven bearish price action, convincing everyone that the company's ER would read as a failure today.
What an absolute joke. Easy money. For now.

$CLS 𝐂𝐞𝐥𝐞𝐬𝐭𝐢𝐜𝐚: 𝐐𝟑 𝐄𝐚𝐫𝐧𝐢𝐧𝐠𝐬 𝐚𝐧𝐝 𝐑𝐞𝐯𝐞𝐧𝐮𝐞 𝐁𝐞𝐚𝐭 𝐄𝐬𝐭𝐢𝐦𝐚𝐭𝐞𝐬, 𝐅𝐘𝟐𝟎𝟐𝟕 𝐑𝐞𝐯𝐞𝐧𝐮𝐞 𝐆𝐮𝐢𝐝𝐚𝐧𝐜𝐞 𝐒𝐨𝐚𝐫𝐬 𝐭𝐨 $𝟒𝟎𝐁 𝐨𝐧 𝐀𝐈 𝐃𝐞𝐦𝐚𝐧𝐝
⠀
📊 𝐑𝐞𝐬𝐮𝐥𝐭𝐬
• Adj. EPS: $3.30 (Est. $2.97) ✅, +109% YoY.
• Revenue: $5.83B (Est. $5.47B) ✅, +83% YoY.
• GAAP EPS: $3.26 (vs. $2.31 YoY).
• Adj. Operating Margin: 8.5% (vs. 7.6% YoY).
• GAAP Operating Margin: 7.9% (vs. 10.2% YoY).
• CCS Revenue: $4.87B, +102% YoY.
• ATS Revenue: $960M, +23% YoY.
• Hardware Platform Solutions Revenue: ~$2.3B, +70% YoY.
⠀
🎯 𝐆𝐮𝐢𝐝𝐚𝐧𝐜𝐞
• Q4 2026 Revenue: $6.275B–$6.575B, midpoint $6.425B (Est. $6.40B) ✅.
• Q4 2026 Adj. EPS: $3.37–$3.57, midpoint $3.47.
• FY2026 Revenue: $21.0B (Est. $20.61B) ✅, raised from $20.5B.
• FY2026 Adj. EPS: $11.55 (Est. $11.17) ✅, raised from $11.30.
• FY2026 Free Cash Flow: $460M, cut from $600M.
• FY2027 Revenue: $40.0B (Est. $35.71B) ✅, +90% YoY.
• FY2027 Adj. EPS: $21.50.
• FY2027 Adj. Operating Margin: 9.0%.
• FY2027 CapEx: $1.5B–$2.0B.
⠀
📌 𝐊𝐞𝐲 𝐓𝐚𝐤𝐞𝐚𝐰𝐚𝐲𝐬
• Q3 Adj. EPS beat consensus by ~11.1%, while revenue exceeded estimates by ~6.6%.
• FY2027 revenue guidance of $40B stands ~12% above consensus, implying 90% growth.
• Connectivity & Cloud Solutions revenue surged 102% YoY to $4.87B, driven by AI infrastructure demand.
• Adjusted operating margin reached a record 8.5%, expanding 90 bps YoY.
• Management expects 2028 customer demand to be meaningfully higher than its 2027 revenue outlook.
• FY2026 free cash flow guidance was reduced by $140M to $460M due to working capital investments supporting 2027 growth.
• Celestica raised $3.45B through a public offering and plans a new share repurchase program of up to 2.5% of public float.
⠀
💬 𝐌𝐚𝐧𝐚𝐠𝐞𝐦𝐞𝐧𝐭 𝐂𝐨𝐦𝐦𝐞𝐧𝐭𝐚𝐫𝐲
“Celestica is well-positioned to continue to support leading hyperscalers and frontier AI labs through the ongoing AI infrastructure supercycle.”
Made my initial entry off lows here ahead of its earnings. A long-term position I am willing to DCA into.
May take a long time to play out. I am patient enough.
$CLS 🟡 Earnings Watch
Confirming the Bear Case outcome discussed last week, Celestica has now invalidated overextension of its Primary Wave 5 setup and opted to break down alongside other semiconductors, in particular $AVGO. Thus, this chart has been subject to a Major Top via LT Wave 1 since June when it reached the cumulative psychological resistance of its PW5 1.618 Fib PT ($436) + 2.272 Log Fib S&R ($463).
Knowing this fact clears up the picture ahead. Now in LT Wave 2, it has retraced enough for a minimal Major Low, but there are yet to be signs of life. With earnings tomorrow, the fallout will determine how deep market makers want to force this name. Despite its valuation being remarkably tame and enticing when considering their explosive growth in store, the chart is currently considered broken. Refer to $NOW. Anything is in the realm of possibility when FUD hits the tape.
Technically, the stock is now finding support off its 1.618 Log Fib S&R ($253) for now, which shares confluence with a Daily BOB. Right below is the Weekly 100MA ($239) + LTW2 .5 Fib ($238) offering a cushion with the bottom of its Log DT Channel.
This all comes as the Daily RSI (26) is the lowest since April 2025. Also, the Weekly William R% reading is showing potential Bullish Divergence as it reaches trenches that typically indicate lows for the stock. Never guaranteed and hard to time though as downside momentum accelerates. Personally, I cannot see this name come below the low $200s, but let's see.
Note. This is my favorite stock from a R/R perspective long-term so I am a bit biasd. I plan to heavily invest in the company once reversal confirmation arrives unless signs of a bottom come prior to that and are nearly guaranteed.


$MU
Nothing has changed. Question now is whether it will be able to hold the local low established in late July.
It perfectly bottomed out between the $730-$750 zone I mentioned back then. Business as usual.

$MU
LT Wave 5 PT = $1530+ 🟢 Subject to Change
*Post-LTW4 Correction Completion
Currently in LT Wave 4 correction, it requires to digest the recent upside before having its finale to complete the ongoing Bull Cycle via LT Wave 5.
At this time, it has distributed at highs and converted that volume to resistance. It is now searching for a local low. The initial area with strongest confluence on the road lower at this time is the $730-$750 area, which offers the 1.618 Log Fib + Minor Volume Shelf + Weekly 21EMA + Bi-Daily BOB. Note that this may only muster a B-Wave countertrend rally rather than outright recovery into LTW5.
It has found support today as well and reached an adequate retracement for LTW4 to support the idea of recovery, but it has many tests ahead to resume its uptrend. There is heavy resistance present in the $900s.

$CLS 🟡 Earnings Watch
Confirming the Bear Case outcome discussed last week, Celestica has now invalidated overextension of its Primary Wave 5 setup and opted to break down alongside other semiconductors, in particular $AVGO. Thus, this chart has been subject to a Major Top via LT Wave 1 since June when it reached the cumulative psychological resistance of its PW5 1.618 Fib PT ($436) + 2.272 Log Fib S&R ($463).
Knowing this fact clears up the picture ahead. Now in LT Wave 2, it has retraced enough for a minimal Major Low, but there are yet to be signs of life. With earnings tomorrow, the fallout will determine how deep market makers want to force this name. Despite its valuation being remarkably tame and enticing when considering their explosive growth in store, the chart is currently considered broken. Refer to $NOW. Anything is in the realm of possibility when FUD hits the tape.
Technically, the stock is now finding support off its 1.618 Log Fib S&R ($253) for now, which shares confluence with a Daily BOB. Right below is the Weekly 100MA ($239) + LTW2 .5 Fib ($238) offering a cushion with the bottom of its Log DT Channel.
This all comes as the Daily RSI (26) is the lowest since April 2025. Also, the Weekly William R% reading is showing potential Bullish Divergence as it reaches trenches that typically indicate lows for the stock. Never guaranteed and hard to time though as downside momentum accelerates. Personally, I cannot see this name come below the low $200s, but let's see.
Note. This is my favorite stock from a R/R perspective long-term so I am a bit biasd. I plan to heavily invest in the company once reversal confirmation arrives unless signs of a bottom come prior to that and are nearly guaranteed.
$QQQ $IXIC $SMH $SOXX 🟡 Relief Inbound?
At this time, it seems my call for a Wave 3 Major Top on the Semiconductor ETFs in June has played out well. Fortunately, we were also able to capitalize on the temporary upside experienced in early August before shifting towards a cautious stance due to my expectation that breadth was bound to deteriorate as it has when referring to $RSP.
Since then, many investors have struggled. We have not. The market is now interesting to me once more now that several individuals names, indices, and ETFs are finally breaking down towards levels of interest.
At this time, McClellan Oscillator and Put/Call Ratio data points are not enticing and convincing enough to pinpoint a Major Low with confidence; however, there are unique circumstances present that suggest relief is forthcoming for $QQQ $IXIC $SMH $SOXX. I will discuss these points below.
Refer to Image 1, showcasing the NASDAQ McClellan Summation Index. It has now dug itself deeper and deeper, reaching -800. This is an extreme, and a level that hasn't been visited since late 2023 and early 2025, post-major corrections. Not only that, it appears to be developing a Bullish Divergence off lows relative to $QQQ $IXIC as $NASI forms higher highs while the index forms lower lows.
Moving on. $VIX failed to form higher highs as the market carved out lower lows last week. This is textbook SMT Bullish Divergence for now as it fails to also break and close above the Key Level of 20. Sure, the Volatility Index is still coiled and primed for upside, but it may not yet be ready for its explosive move. We will find out soon. If it stays stuffed and cannot form the higher high, then it's a poor look for Bears.
Now onto the HY Credit Spread chart. As I predicted in September, it has now exploded higher with a Bollinger Band squeeze + expansion on the Weekly chart, breaking above the initial key level of 3.20. It is now in-line with the highs found during the early 2026 correction. However, it must be noted that it is forming Bearish Divergence on the Daily charts and it has now closed above the Upper Bollinger Band 5 weeks in a row. This persistence may lead to a snapback to either form a Higher Low or crash down soon, coinciding with relief on indices/ETFs discussed above. I'd lean towards a Higher Low for now as rising rates and inflation are stubborn and our new reality.
Finally ... the chart for $SMH. Semiconductors are now in a Wave 4 correction. It has yet to reach my minimal ideal retracement target of ~$480, coinciding with the .382 Fib and 1.786 Log Fib S&R. This would offer a clean ABC correction prior to taking off to ATHs for one last strong move via Wave 5. Downside risk over larger timeframes is evident due to the loss of the Weekly 8/21EMAs + Weekly 20MA two weeks in a row. This has not happened since early 2025 and carried significant follow-through risk if bearish catalysts pronounce themselves. That said, relief could come soon when considering the details discussed above alongside RSI Bullish Divergence developing on the Daily chart for $SMH as it nears the Daily 200MA. A Double Bottom could occur here off low $500s for at least a temporary relief rally. I'm not sure if I'd expect it to complete Wave 4 early and head towards ATHs yet. Another data point to suggest a bounce is the fact that the Williams R% on the Weekly chart for $SMH is pretty buried now with its own Bullish Divergence.
Sorry if this post was a bit messy to read. Just spitballing a lot of information off the cuff.


There is a compelling case for a reversal approaching for Semiconductors and the NASDAQ.
However, I am not entirely convinced this would mark the ultimate low. Several key data points have yet to align and fire bottoming signals, leaving the door open to an additional leg lower on indices/ETFs following sustained relief here.
I’ll share my findings later today.