Data Orbital (@Data_Orbital) header
Data Orbital (@Data_Orbital) profile picture

Led by @George_Khalaf, we're an analytics & survey firm crafting data-driven solutions for our clients. Top 10 pollster in America by @FiveThirtyEight.

Phoenix, AZ
Joined August 2016
Photo by Data Orbital (@Data_Orbital)Photo by Data Orbital (@Data_Orbital)Photo by Data Orbital (@Data_Orbital)Photo by Data Orbital (@Data_Orbital)Photo by Data Orbital (@Data_Orbital)Photo by Data Orbital (@Data_Orbital)Photo by Data Orbital (@Data_Orbital)Photo by Data Orbital (@Data_Orbital)Photo by Data Orbital (@Data_Orbital)Photo by Data Orbital (@Data_Orbital)
TODAY’S SPOTLIGHT: LD13 | October 28 46,816 early ballots returned. Republicans lead by 1,097 ballots—a 2.3% advantage, versus 2.4% at the same point in 2022. Overall turnout is nearly unchanged: 31.9%, compared with 32.0% in 2022. 🧵
1
1
3
837
Similar overall turnout, different party trends in LD13. Democratic turnout is 42.6%, versus 40.0% in 2022. Republican turnout is 35.1%, versus 34.4%. PND/Other trails its 2022 rate: 21.5% versus 23.1%. Voters with a 4/4 general-election history account for 31,780 returns.
1
261
MARICOPA COUNTY | October 28 update Maricopa added 96,759 returned ballots since our previous update. The Republican ballot advantage widened from 7,660 to 9,177. The county now accounts for 755,873 of Arizona’s 1,260,057 returns. A closer look. 🧵
1
8
31
1,434
More ballots, nearly the same turnout: Maricopa has 9,231 more returns than at this point in 2022, but turnout is 29.2% versus 29.3%. Among voters who participated in all four prior general elections, 57.4% of issued ballots are back, compared with 13.9% for the 0/4 group. County and LD tables
305
ARIZONA BY COUNTY | October 28 update Gila shows why turnout and ballot advantage differ. Republican turnout is 37.7%, versus 36.8% for Democrats, yet Republicans lead returned ballots by 4,029—a 32.1% advantage. Both measures for all 15 counties. 🧵
2
9
22
1,549
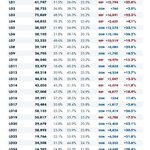
In LD4, Democratic turnout has crossed 50%—now 51.1% of registration, versus 38.5% for Republicans. Republicans still lead returned ballots by 2,635, reflecting their larger registration. The ballot-advantage and turnout tables for all 30 LDs:
2
297
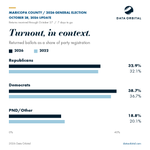
ARIZONA EARLY VOTING | October 28 update The latest update adds 142,534 returned ballots statewide. The Republican ballot advantage narrowed from 9,832 to 7,155. Total returns now stand at 1,260,057, with turnout at 27.8%. The statewide breakdown. 🧵
3
3
1
18
1,537
Republican and Democratic turnout are ahead of their 2022 rates. PND/Other turnout is 17.8%, versus 19.0% at the comparable point in 2022. 145,188 returns come from voters who participated in zero or one of the last four general elections. Two views of who is voting.
1
265
MARICOPA COUNTY | October 27 update More than one in four registered voters has returned a ballot: 659,114 returns and 25.5% turnout. Republicans hold a 7,660-ballot advantage, or 1.2% of returns. The county’s early-voting picture. 🧵
1
10
1,414
Maricopa’s early turnout by registered party: Republicans: 28.9% Democrats: 34.0% PND/Other: 16.0% Among voters who participated in all four previous general elections, 443,371 ballots have been returned—51.1% of those issued. Turnout and voting history together:
2
410
ARIZONA BY COUNTY AND LD| October 27 update Pima has 183,772 returned ballots, with Democrats ahead by 38,401—a 20.9% ballot advantage. Turnout by registered party: 28.6% Republican, 37.8% Democratic and 18.1% PND/Other. Both measures for all 15 counties. 🧵
1
5
1,167
LD17 has 63,139 returned ballots. Democrats lead by 1,611, a 2.6% ballot advantage. Turnout within each party’s registration: Republicans: 32.6% Democrats: 46.0% PND/Other: 24.3% Ballot advantages and turnout across all 30 legislative districts:
1
299
ARIZONA EARLY VOTING | October 27 update Arizona has passed 1.1 million returned ballots. Republicans lead by 9,832 ballots, a 0.9% advantage. Turnout is 24.6%, compared with 24.4% at the comparable point in 2022. The statewide breakdown. 🧵
2
4
14
1,669
Arizona’s early turnout by registered party: Republicans: 27.4% Democrats: 33.2% PND/Other: 15.5% Voters who participated in all four previous general elections have returned 735,067 ballots—65.8% of the total. Two charts on turnout and voting history.
1
1
1
3
3,562
MARICOPA COUNTY | October 26 update 559,258 early ballots have been returned. Republicans lead by 3,967 ballots, a 0.7% advantage. Turnout is 21.6%, compared with 20.8% at the same days to go in 2022. The county’s early-voting picture. 🧵
1
1
1
6
1,462
Maricopa’s early turnout by registered party: Republicans: 24.5% Democrats: 29.2% PND/Other: 13.4% Voters who participated in zero or one of the previous four general elections have returned 55,134 ballots—9.9% of the county total. Turnout and voting history together:
288
ARIZONA EARLY VOTING | October 26 update 935,727 ballots returned. Republicans lead by just 438 ballots, less than 0.1% of returns. Overall turnout is 20.6%, versus 20.8% at the comparable point in 2022. The statewide breakdown. 🧵
2
6
18
3,571
Arizona’s early turnout by registered party: Republicans: 22.8% Democrats: 28.3% PND/Other: 12.8% Voters who participated in three or four of the previous four general elections account for 766,450 returns—81.9% of the total. Two charts on turnout and voting history.
425
ARIZONA BY COUNTY | October 23 update Gila’s party turnout is nearly even: 27.1% Republican and 27.8% Democratic. But Republicans lead returned ballots by 2,762, or 30.4%, reflecting their larger registration. Both measures for all 15 counties. 🧵
2
1
5
1,573
LD2 has just 183 ballots separating Democratic and Republican returns. Turnout within each party’s registration: Republicans: 20.7% Democrats: 26.6% PND/Other: 11.3% These two tables pair ballot advantages with turnout across all 30 legislative districts.
1
428