

Tech Talk is a free stock market letter service available at https://xitter.gq/t.co/BJV0N7vrq2 and https://xitter.gq/t.co/qBCl3egWXc. Ask us about the Seasonal Advantage Portfolio.
America
Joined December 2009
- Tweets14.3K
- Following424
- Followers10.1K
- Likes405


Pinned Tweet
Out now…
Our monthly report for October is available for download, providing insights, analysis, and trade ideas to navigate the market through the month(s)/year ahead.
Subscribe now to receive this 106-page report: charts.equityclock.com/subsc…
#Stocks #Bonds #Commodities #Gold

Certainly working as a great hedge in equity portfolios today.
As highlighted in our last Market Outlook, “seasonally, the VIX tends to peak and roll over at this time of year as investors reach out on the risk spectrum. However, no rollover in the VIX, no broad November rally in the equity market.” $SPY $QQQ $VXX $UVXY


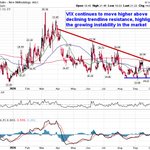
One of the things that we have been tracking to determine the stability of the market heading into its seasonally strong phase for stocks is the action in the Volatility Index (VIX). The positive reaction this so-called fear gauge has shown to recently broken declining trendline resistance is not exactly confidence inspiring to assure the market has regained a stable footing. The VIX may be an ideal hedge for portfolios heading into next week’s mid-term election day.
$VXX $VIXY $UVXY

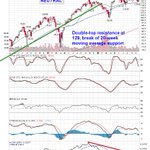
Upon revelation of the risks to the market from the development of a head-and-shoulders pattern last week, we informed subscribers to rotate out of the Tech heavy S&P 500 $SPY and flip to the more defensive Equity Premium Income Fund $JEPI. Know when to take down risk in portfolios when the risk in the market ramps up.
The head-and-shoulders pattern on the large cap benchmark proposes a downside target of 7400.

The inverse correlation of the equity market to the odds of a democratic sweep that we have been highlighting to subscribers continues. Odds of a blue wave according to Polymarket are ramping up heading into election day and pressures against stocks have increased. The good news is that Tuesday’s vote is expected to act as a clearing event to this uncertainty. $SPX $SPY $QQQ

Our initial downside target at 3920 for Gold that we provided to subscribers has been hit, but the chart of the precious metal has bigger problems after breaking below long-term rising trendline support. For the first time in years, momentum indicators on the weekly chart have developed characteristics of a bearish trend below their middle lines.
Gold is currently within its weaker time of year that runs through to late December, resulting in underperformance versus the market.
Next level of reference for Gold is the spring 2025 highs around 3450.
$GLD $GDX #GOLD


With all this carnage in large-caps, we are looking to build a portfolio around Mid-Caps during the best six month timeframe for stocks. equityclock.com/2026/10/29/s… $IWR $SPY $QQQ

Seasonally, the VIX tends to peak and roll over at this time of year as investors reach out on the risk spectrum. No rollover in the VIX, no broad November rally in the equity market. $VIX $SPX

One of the things that we have been tracking to determine the stability of the market heading into its seasonally strong phase for stocks is the action in the Volatility Index (VIX). The positive reaction this so-called fear gauge has shown to recently broken declining trendline resistance is not exactly confidence inspiring to assure the market has regained a stable footing. The VIX may be an ideal hedge for portfolios heading into next week’s mid-term election day.
$VXX $VIXY $UVXY


Is it really a weak market when Value $IWD is recording fresh all-time highs? Money is not exiting this market, it is just rotating, allowing us to maintain our elevated equity exposure. We have been suggesting to our subscribers that they Accumulate the Value ETF all year and the outperformance it has shown has been incredible. $SPY $QQQ


The rise in the Dollar, Rates, and Oil remain the primary risks against the market heading into the seasonally strong phase for stocks through the next six months. equityclock.com/2026/10/28/s… $UUP $USO $SPY

The Communication Services sector $XLC just can't seem to catch a break. Following sharp declines and a breakdown from its prolonged trading range from the past 15 months, the current plunge in shares of Alphabet $GOOGL are poised to fulfill the topping pattern that the sector has been suggesting. We have been telling our subscribers to Avoid (Sell/Short) the sector for months.

An abnormal September increase in US Imports has widened the monthly trade deficit to the third largest level on record at $145.5 Billion. Imports are up by 25.4% through the first three-quarters of this year, performance that is unprecedented in modern history and well ahead of the 7.5% rise that is average for this timeframe.
So much for tariffs balancing trade.
$STUDY $MACRO #Economy #Trade #Tariffs


US New Home Sales are eerily unchanged through the first three quarters of the year, highlighting weakness in the housing market that is akin to periods of economic recession. The median price of new homes sold is showing the second largest drawdown three-quarters of the way through the year in the past three decades. Housing is certainly sending a warning sign pertaining to the health of the economy. $STUDY $MACRO $ITB #Economy #Housing


US Durable Goods Orders continue to run strong heading into the end of the year, conducive to strength in pro-cyclical segments of the market through November and December. Orders of Durable Goods jumped by 9.2% (NSA) in September, well ahead of the 5.3% increase that is average for this end of quarter month. $STUDY $MACRO $XLI $XLB
