

FXing for SIL since 1987. Went to college to learn how to help farmers find better weather info. Still pursuing that goal. WKU UNCA
Carterville, IL
Joined December 2008
- Tweets11.3K
- Following495
- Followers5.6K
- Likes3.3K




30 degrees at my place in Williamson county this morning ends my growing season on paper. Last spring freeze was March 29 making season 223 days.
Average dates and duration at my place: Apr 7 - Oct 26, 203 days.
3rd longest in my book behind 2011 and 2017.
4
200
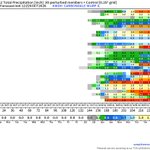
Rainfall projection is a wet solution locally during the next 48 hours but almost no wet signal after that to mid-November.

3
201

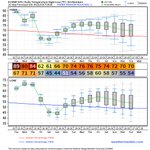
Unseasonably warm conditions projected to persist into the first week of November. A bubble of cool air is in the charts and shows up in the numeric data for week 2. The dramatic appearing drop is just back to near normal temperatures.

163
The concept of wet weather arriving locally is still in the projections but amounts are showing inconsistency. 3 of the 30 solutions are .10" or less with one at 0. 5 of the solutions are 3" or more. In my opinion any rain at this point will be beneficial even if it brings a brief interruption to harvest progress. Looks like we can expect rain but the feast/famine solution we have experienced all summer might verify again.

3
244

The overall dry 10 day rainfall projection is starting to build some consistency in consensus around the idea of some rain locally during the Halloween weekend.

1
144
Temperature projection next 10 days continues to present warmer than normal with a seasonal decline. We will likely be well into November before the first freeze.
During my career the average date of first 32 or less has moved from the 2nd week of October to the last week of October and we have seen several events into November in recent years. Technically a longer growing season but the loss of daylight and GDD limits extended season gains.
It is nice to harvest the last batch of tomatoes in November.

2
161

Overall dry projection locally for next 10 days. 28 of 30 solutions present less than 0.25" total precipitation. 26 of 30 less 0.10".

148
Couple takeaways for me on the temperature projection data.
Normal high for today is 70. I had to look twice. We have been so warm for so long my perception is skewed.
There is a cooldown in the data BUT, only 3 days in this 2 week chart are cooler than normal. I like to wear flannel. Patience.

2
161
Best signal from precipitable water projection we have seen locally in a while. This cold front event should bring rain to the lower Ohio River valley Wednesday (10/14) and an end ... for now ... of near record heat.

2
280
Cold snap projected arrival around Oct17-18 appears in multiple solutions but with some variability in just how cold. The warm period before is much warmer in other solutions but appears lower Ohio River valley is in for another round of warm afternoons before cool air arrives for the second half of October.

3
222
Same concept as yesterday's projection that heaviest rain from tropical moisture is expected east and south of us. Timing is focused late Saturday into early Sunday.

1
177
Rainfall projection for possible tropical impacts locally. Remembering that bigger impacts from moving tropical system are predominately on the right side of the axis of movement it makes sense we see larger projections east and south of us.
monitoring ...

1
4
280

The numeric guidance on the incoming chnace of rain locally is inconsistent on timing and amounts BUT still exists with focus back to Thu-Fri (Oct1-2). Temperature projections show a little more consistency with a return to near normal temperatures after a brief warm-up for the this week.
Lows on low side of normal line and highs on the warm side lead me to infer low humidity and clear (ish) skies in that period suggesting more dry weather locally in week 2. Week 2 charts support the idea of dry.

4
177

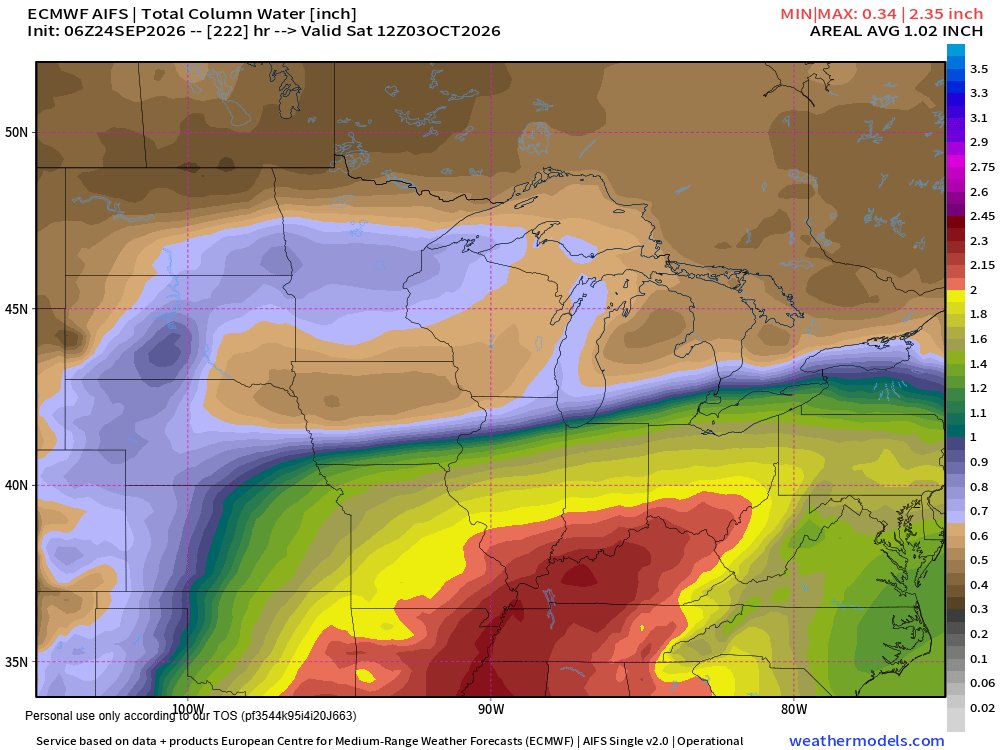
Numeric data has been increasing projected rain amounts around Sep30-Oct2 period so I went to a favorite map data product and it aligns with an increased water vapor flow from the Gulf adding some confidence in the chance of significant rain for that period.
Current numbers suggesting more than an inch of rain projected for the lower Ohio River valley.
5
203
There is some inconsistency from one run to another but the warm bump appears in most solutions around Sep29-30 and is accompanied by a chance of rain locally. Not a big chance and not very much quantity, but a chance. The first week of October has been very inconsistent in temperature outlooks with latest solutions trending down. Just 2 days ago much warmer numbers appeared in this timeframe. Worth monitoring for a few days to find consistency.

3
176