

The AI-powered developer platform to build, scale, and deliver secure software.
- Tweets11.1K
- Following335
- Followers2.7M
- Likes9.1K






ALT Chart titled "Coding Agent Index vs. Cost per Task" by Artificial Analysis. The chart displays Artificial Analysis Coding Agent Index vs. average pay-per-token API cost per task (USD). It compares various agents, including some from Claude Code, Codex, Antigravity CLI, DeepSeek Harness, Grok Build, Opencode, Muse Code, Kimi Code CLI, and GitHub Copilot. The x-axis represents higher cost per task (USD) to lower cost per task (USD), and the y-axis represents the coding agent index. The chart highlights a "Most Attractive Quadrant" in green and uses dots to differentiate agents. Copilot Fusion (max) sits within the most attractive quadrant.

ALT Bar chart titled "Artificial Analysis Coding Agent Index". Incorporates 3 benchmarks: FrontierCode v1.1, Terminal-Bench 4.0, SWE-Atlas-QnA-AA. A higher scroe denotes higher average intelligence across becnhmarks. Copilot Fusion Max from GitHub Copilot has a score of 60. The chart also includes various coding agents from Claude Code, Devin Fusion CLI, Antigravity CLI, Codex, Grok Build, DeepSeek Harness, Muse Code, Opencode, Antigravity CLI, and Kimi Code CLI, with scores ranging from 62 to 41. Source and logo of Artificial Analysis are included at the bottom.


ALT Assess your skills with GitHub Copilot Verified Proficiency. Get evidence-based suggestions about how effectively you work with GitHub Copilot.


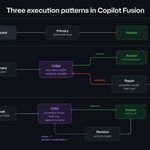
ALT Diagram titled "Three execution patterns in Copilot Fusion," comparing three workflows: Single, where a primary model uses tools to request an answer; Cascade, where a primary model makes a first pass before a judge model either accepts its result as the answer or escalates to a repair model for a fresh-start answer; and Critique, where a primary model drafts an answer and a read-only critic either approves it as-is or requests a revision by the primary model.


ALT Virtual badger controlling virtual octolamp




ALT A cat with black and white fur is lying on a person's arm, which is on a computer desk next to a keyboard.

ALT A relaxed cat lays sprawled on a wooden desk, resting its head near an open laptop.

ALT A black and white cat is sleeping on its side on a wooden desk.

ALT A cat is sleeping on a wooden desk beside a laptop and keyboard.