

Genes (ISSN 2073-4425, IF 2.8), an #OpenAccess journal of #Genetics and #Genomics published online by @MDPIopenaccess
- Tweets6.2K
- Following771
- Followers2.1K
- Likes6K






ALT 🔹 New Key Dates: ✔ Abstract Submission Deadline: 4 September 2026 ✔ Abstract Acceptance Notification: 30 September 2026 This is your opportunity to share innovative ideas, connect with global experts, and be part of vital discussions.


ALT 🎤 Silvia Turroni is Associate Professor in Chemistry and Biotechnology of Fermentation, at the Unit of Microbiome Science and Biotechnology, Dept. Pharmacy and Biotechnology, University of Bologna (Bologna, Italy). She has over 15 years of experience in the compositional and functional profiling of the human microbiome and the exploration of its impact on health. She has strong expertise in next-generation sequencing technologies, including 16S rRNA gene sequencing and omics approaches, i.e., metagenomics, metatranscriptomics and, more recently, culturomics, as well as in microbiome-host interaction studies in ex vivo models.

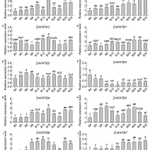
ALT Relative expression levels of ZmFAT genes in the lower tissue of seeds after pollination. The horizontal axis represents different sampling stages (4, 5, 6, 8, 10, 12, 16, 20, 24, 28, 32 days after pollination). Different letters indicate significant differences between treatments (p < 0.05). (A–J) represent the expression levels of different genes, with each panel labeled with the corresponding gene name and figure designation.

ALT Silencing the NbHECT6 and NbHECT13 genes in N. benthamiana increases its susceptibility to tomato yellow leaf curl virus (TYLCV) infection. (a) Silencing efficiency was evaluated by quantitative PCR (qPCR) at 10 days post-inoculation (dpi). The data are expressed as relative mRNA levels, with values for the control group (N. benthamiana plants agroinfiltrated with TRV:GFP) set at 100%. (b) Disease symptoms induced by TYLCV in NbHECT6 and NbHECT13 silenced N. benthamiana plants at 21 dpi. TRV:GFP agroinfiltrated N. benthamiana seedlings infected with TYLCV served as the control. (c) Relative accumulation of TYLCV genomic DNA was assessed in the NbHECT6 and NbHECT13 silenced N. benthamiana plants. Viral accumulation was quantified by qPCR, as depicted in (a). Data are presented as relative viral DNA accumulation, with values for the TRV:GFP control plants set to 1.0. For panels (a,c), data are presented as means ± standard deviation of three independent biological replicates.

ALT Effects of ALDOA Gene Overexpression on Porcine Skeletal Muscle Satellite Cell Differentiation. (A): Expression levels of the ALDOA gene at different differentiation days; In (A), the letters “a b c d” denote: Identical letters indicate no significant difference (p > 0.05)—Different letters indicate significant differences (p < 0.05) (B): Effects of ALDOA gene overexpression at Day 0 on porcine skeletal muscle satellite cell differentiation; (C): Effects of ALDOA gene overexpression at Day 5 on porcine skeletal muscle satellite cell differentiation; (D): Western Blot detection of gene expression levels in porcine skeletal muscle satellite cells at Day 0 of differentiation; (E): Protein-level quantification at Day 0; (F): Western Blot detection of gene expression levels in porcine skeletal muscle satellite cells at Day 5 of differentiation; (G): Protein-level quantification at Day 5. (* p < 0.05,** p < 0.01,*** p < 0.001, “ns” means p > 0.05).

ALT Diploid-tetraploid distribution area of Paspalum notatum. Diploid cytotype (red dots) is distributed inside the center of origin of the species (green line) and in ectopic localities in Brazil and Paraguay. Tetraploids (black dots) are positioned around the diploid primary center and extend across a larger area. All ectopic diploids are located outside the region marked with a green line, and are outside of cultivated areas. The dotted blue line indicates the limits of the suggested possible area of origin for the species. All dots represent 2x and 4x accessions detailed in Table S1.

ALT Relative expression of Zm00001d010154 across environments. (A) Differences in β-PH (left) and β-EH (right) between T32 and Mo17; (B) Relative expression level of Zm00001d010154 in T32 and Mo17 under Zhangye (left) and Sanya (right) environments; *, Student’s t-test, p < 0.05.

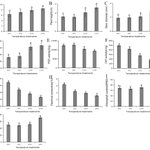
ALT Phenotypic and physiological responses of Chinese cabbage cultivar LY2 to different cold (low temperature) stress conditions. (A) Leaf number; (B) plant height; (C) stem diameter; (D) leaf area. (E) POD activity; (F) CAT activity; (G) proline content; (H) electrical conductivity; (I) chlorophyll content; and (J) soluble sugar accumulation. Data are presented as mean ± SE of mean (n = 10). Different letters above bar graphs show significant difference (p < 0.05) between or among different temperature treatments.

ALT A model for the feed forward loop in deregulated E2F1 activity through induction of DDX5. DDX5 enhances deregulated E2F1 activity, which in turn activates the DDX5 gene, thereby forming a feed forward loop in deregulated E2F1 activity that activates tumor suppressor genes.

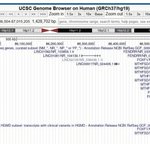
ALT Physical map of the 16q24.1 region (nucleotides 85,586,504 to 87,015,205, GRCh37/hg19) adapted from UCSC Genome Browser, region involved in the microdeletions of case 9. All coding genes included in this region are annotated

ALT WGCNA analysis. (A) Determination of soft threshold of gene co-expression network. (B) Gene co-expression module hierarchical clustering map. (C) The correlation heatmap for E. multilocularis larvae infection and infection period. (D–G) Screening modules for gene co-expression networks and core genes: (D) cyan module; (E) tan module; (F) yellow module; (G) red module.

ALT Behavioral analyses: prepulse inhibition of an acoustic startle response. (A) Startle amplitude to a 120 dB acoustic stimulus. * represents p < 0.05. (B) Sensorimotor gating was assessed by analyzing prepulse inhibition (PPI) separately in male and female mice. We detected a main effect of genotype (p < 0.05), suggesting impaired PPI in Snord116p−/m+ mice relative to the WT (p < 0.05), indicated on the right by *. A main effect of sex and a sex x genotype interaction were also determined (p < 0.05), and post hoc analysis determined a significant impairment in PPI in female Snord116p−/m+ mice relative to the WT at a 74 dB prepulse intensity, indicated by ** (p < 0.01). No significant difference was detected between WT and Snord116p−/m+ mice at any other prepulse intensity (n.s.).

ALT Retinal imaging in inherited retinal diseases (IRDs) showing different forms of cystoid macular lesions (CMLs). From left to right: color fundus images (Clarus 700, Carl Zeiss AG, Oberkochen, Germany), fundus autofluorescence and OCT images (Spectralis, Heidelberg Engineering, Heidelberg, Germany). The IRD due to mutations in MFRP includes the following: nanophthalmus, retinal degeneration, foveoschisis, and optic disc drusen. AD-RP: autosomal dominant retinitis pigmentosa, AR-RP: autosomal recessive retinitis pigmentosa, ESCS: enhanced S-cone syndrome, XLRP: X-linked retinitis pigmentosa, and XLRS: X-linked retinoschisis. The lower panel shows images of a healthy control for comparison.

ALT Expression of genes and proteins related to fatty acid metabolism. (A) No differences were detected in the expression of Gpam in the cerebral cortex of NPC mice. (B,C) The genes Smpd1 and Abcd1 were found under-expressed in the NPC group. (D,E) The SGPL1 and SPHK1 proteins did not differ in NPC mice from those of the WT mouse group. (F,G) Elevated levels of the proteins ACOX1 and ACAA1 were found in the cerebral cortex of NPC mice. (H) Altered fatty acid beta-oxidation pathway in NPC. Overexpression (Up red arrow), Underexpression (Down red arrow). Gapdh/GAPDH was used as a normalization gene and protein expression. A T-Student test was performed to determine statistical significance. The normality of data was determined using the Shapiro–Wilk normality test and the Rout outlier test to detect outliers. ** p ≤ 0.01, * p ≤ 0.05. ns: not significant.

ALT Association of SLC30A8 rs1326634 with HDL-c. Associations of the functional variant in the SLC30A8 gene (rs1326634) with HDL cholesterol levels in the female cohort. We used the three genotypes CC, CT, and TT (a) and the dominant genetic model (b) (CC + TC and TT) to compare the two different fat distributions (WHR > 0.85 and WHR ≤ 0.85).

ALT Convergent pathway enrichment between YAPC LGALS3 knockout transcriptomes and LGALS3-correlated genes in TCGA-PAAD. Hierarchical clustering of Gene Ontology (GO) and pathway enrichment scores for differentially expressed genes from YAPC pancreatic cancer cells following CRISPR/Cas9-mediated knockout of LGALS3, together with genes significantly correlated with LGALS3 expression in TCGA-PAAD. The heatmap cells are colored by their p-values and significant terms are hierarchically clustered based on their statistical similarities.

ALT Long-read RNA-seq identified isoforms and expression levels. (A,B) Expression levels obtained by lrRNA-seq for each known and novel isoform of the selected eight genes, using both (A) GRCh38 (HG38) and (B) T2T-CHM13 (T2T) methods. Isoform expression of four fusion genes by (C) HG38 and (D) T2T methods: CTBS::GNG5, PRIM1::NACA, IFNAR2::IL10RB, and DNAJC4::NUDT22. The total number of isoforms and the TPM expression of each single isoform are shown in the graphs. The total numbers of known and novel isoforms are annotated for each blood sample at the base of the graphs.


ALT Documentation of AP test result. Positive AP test results are represented by either (a) a simple or (b) a complex purple colouration on chromatography paper. Tracing of AP test result back to a mocked crime scene item, such as a black cotton T-shirt, can be accomplished by superimposing the chromatography paper over the T-shirt and either (c) flipping the paper back and forth repeatedly to mark the boundary of the AP stain with a crayon or (d) tracing the AP stain boundary with a stylus or ballpen using TP positioned between the chromatography paper and the T-shirt. The location of the semen stain was successfully mapped with the (e) crayon and the (f) TP.