
https://xitter.gq/t.co/G8of0o8qEd is the leading precious metals market analysis source featuring free content and written by industry expert and speaker Bill Downey
CANADA
Joined December 2011
- Tweets14.1K
- Following827
- Followers15.3K
- Likes32.4K





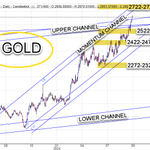


Our last post discussed the Oct pullback had reached a long term trendline at 2598-2610 & should be watched
The low was 2604 & a big move up has occurred since
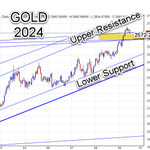
Now near Long Term Resist line 2798-2822
110 Mil Oz traded @ Spot Mkt today
Still a bull but favor resist in this zone

We discussed a few weeks ago that odds favored a pullback from 2650-2700 (High so far 2682)
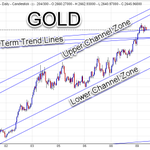
A zoom shows the long term trend lines
PRICE could not make 2647 support & now price at 2598-2608 zone
WKLY Supp ALSO at 2572 area & 2522
Lets see what it does at this line (2598-2610)

$Gold touched this wk's Resist (2672-2722) at 2673 & just missed touching Support (2622-2572) at 2626
Zoom in shows price trying to support on top of a long term trend line intersection zone from 2597 to 2647
It has spent2 wks trying to hold this upper line
Watching 2647 area

Crude OIL (WTI) Long Term
Price touching long term support lines in the 66-68 area at a time when there's a record short position & a potential Middle East Powder Keg situation.
Long Term Support 61-66
Bot Line
A very key price zone to watch
I favor a resolve to the upside

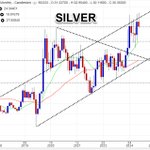
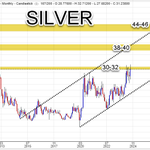
Our previous posts had Silver at 30-32 as 1st long term Resistance
Need a monthly close above 32 to open up the higher levels at 38-40
Sup 24-26
Bot Line = need a close above 32 for next targets to open up

The resistance we discussed last week 2650-2700 was reached as price pushed to the 2670's
We begin the week just under 2650
This week
Resist 2672-2722
Supp 2572-2622
Pullbacks aside, the longer term trend remains up

$Gold potential targets "IF" we get a pullback to December.
The long term bull remains in place.

Long Term $gOLD
Price arriving at Yearly Channel Resistance level (2650-2700)
There are no absolutes, only Odds
If this resistance causes a selloff into year end, odds favor it will be a buy opportunity
While anything can happen to propel price higher, be careful at these levels

$Gold pretty much same as end of April & 1st Wk of May price
Resist
Daily 2372-2382
Wkly 2422-2432
Supp
Daily 2322-2332
Wkly 2272-2282
While I favor trade range into July, a WKLY Close above 2432 would change my outlook
Bigger trend still up but would rather see a July low

$Gold
Volume & price have coincided all year
Big volume & very narrow range suggests market setting up for next $50 move
Watch this 2312 area where 5 Day Mov Ave resides
The 5 day was above other Ave's all year until this pullback began
May usually choppy & tricky
Be careful

$Gold
After favoring choppy & bears below 2245-2265 last wk, price dropped to Wkly Sup 2272-2282 (low =2277)
Bulls attempting to take back control this wk
Key area again is 2345-2365 we discussed last wk
Sup & Resist on chart
GOTTA MAKE that zone on chart 2322-2333 Support

$Gold Daily
1st pause in New Bull Mkt Leg
RARE Gold trades over 150 Milion Oz's in day
This week
Mon 164 M (Highest this decade)
Tues 154 M
Wed 137 M
Thur 150 M
Price $240 above 233 day Mov Ave (2063)
Seasonal Pullback remains in play when below 2345-2365 but Big Pic Bullish


$Gold Long Term
Odds favor a breakout has occurred
3 Sister attempt to hold gold at 1K in 2008 failed & control boyz had to abandon ship
After holding 2k 13 yrs, a 3 Sister attempt has failed in the past 2 months
Now What ?
We might consolidate a few months but stay bullish

$Gold this week
Resistance
DAILY 2245-2265
WKLY 2382-2392
Support
DAILY 2306-2320
WKLY 2372-2382 & 2243-2263
MONTHLY 2243-2263
Key area this wk is that line at 2345 & extending to 2365.
Short term bears control below there
Med & Long term bullish

$Gold
April/May usually choppy & pullbacks to summer often the case in bull mkts
Resist
Monthly 2422-2472
Wkly 2372-2382
Support
Wkly 2222-2232
Breakout Supp 2122-2172 🔑🎯
Yearly 1922-1972 & 1862-1872
Bot Line
Bull Mkt not over
Likely seasonal pullback
Buy zones on chart

We discussed this week that 2145 was a key support
Low this wk=2146
PRE FOMC we said either 2122 or 2222+/- $8 bucks (& our bias was for bulls)
Bulls won & high = 2221
Now prices pulled all the way back inside our key 2172-2182 Wkly resist
Bulls want close ab 2182 today

Last nights update on $gold favored the High Vol area's below on Tues chart to favor support (2145-2152) into FOMC ; Low today 2149.75
Also favored res 2159-2164 & 2163 high
Now back at 2156
FOMC in a couple hrs
Let's see who wins (my bias is bull but on sidelines at the moment

$Gold past 24 hrs settled into range Pre FOMC
High Vol area's Tues favor initial support into FOMC
Highest 2145-2147 - Mid 2147-2151 & LOW 2151-2152
If we break 2145 then 2222 (+/- $8 bucks) can come into play esp after FOMC
Daily Res 2162-2167
Wkly 2172-2182
All eyes on FOMC
