

Be Kind | Crypto Trader & Analyst Built on charts and discipline. Partnered with @BloFin_Official
Earth
Joined May 2026
- Tweets8.2K
- Following5.2K
- Followers6K
- Likes31.1K



Pinned Tweet
$1,000 Futures Bonus is literally on the table. 💰
Deposit $9,000 → $1,000 bonus
Deposit $5,000 → $500 bonus
Deposit $1,000 → $100 bonus
Even $100 gets you $25 (new users 👀)
First 100 users only
Join here:
partner.blofin.com/d/Jemi

50
$SXT /USDT ANALYSIS
SXT is attempting to break above the horizontal supply zone, while the Ichimoku cloud is providing solid support and showing bullish strength.
A decisive candle close above this resistance could confirm the breakout and trigger a strong bullish rally. Keep an eye on this critical level.

1
2
153
$BTC /USDT ANALYSIS
Bitcoin is currently holding above the support trendline of the descending broadening wedge pattern, keeping the potential for a recovery intact.
Meanwhile, the 100MA is acting as a key resistance barrier below the wedge's resistance trendline.
If BTC continues to hold above the support trendline, we could see a potential upward rally in the market.
On the other hand, a confirmed breakdown below this support could trigger further correction.

3
2
122

Join my tg for more crypto insights and campaign bonuses t.me/jemin3

55
$GRAM /USDT ANALYSIS
GRAM has broken out of the descending channel with significant volume, signaling strong bullish momentum.
The 50MA is currently acting as a key support level below the price action, reinforcing the bullish structure.
GRAM appears well-positioned for another upward rally, provided it continues to hold above the breakout level and the 50MA.

3
2
171
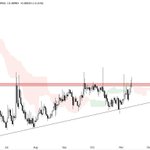
$BTC DOMINANCE ANALYSIS
BTC Dominance is trading inside the horizontal supply zone of the ascending triangle pattern and is currently moving within the Ichimoku cloud, indicating indecision in the market.
A rejection from the supply zone could trigger further downside in Bitcoin Dominance, potentially supporting a bullish move across altcoins.
On the other hand, a solid breakout above the supply zone could invalidate the bearish scenario and trigger further upside in BTC Dominance.
It’s important to note that BTC Dominance often shares an inverse relationship with the altcoin market cap.

2
3
101
$BTC /USDT ANALYSIS
Bitcoin is currently holding above the support trendline of the descending broadening wedge pattern, keeping the potential for a recovery intact.
Meanwhile, the Ichimoku cloud is acting as a key resistance barrier below the wedge's resistance trendline.
If BTC continues to hold above the support trendline, we could see a potential upward rally.
On the other hand, a confirmed breakdown below this support could trigger further correction in the market.

2
89
$BTC /USDT ANALYSIS
Bitcoin is currently holding above the support trendline of the descending broadening wedge pattern, making this a crucial level to watch.
A strong rebound from this support could trigger a potential recovery in price action.
On the other hand, a confirmed breakdown below the wedge support trendline could lead to further correction in the market.

$OPEN /USDT ANALYSIS
OPEN is consolidating within the falling wedge pattern, indicating a potential breakout setup.
A solid breakout above the wedge resistance would provide strong bullish confirmation and could trigger a significant upward rally.
Keep a close eye on the breakout level for confirmation.

#DASH /USDT ANALYSIS
DASH is rebounding from the support trendline of the falling wedge pattern, indicating a potential recovery in price action.
However, the 50MA is currently acting as a key resistance barrier.
A solid breakout above both the 50MA and the wedge resistance trendline would provide strong bullish confirmation and could trigger another significant upward rally.

112
$USDT DOMINANCE ANALYSIS
USDT Dominance is trading below the horizontal supply zone of the ascending triangle pattern, while the Ichimoku cloud is acting as a key support zone.
A solid breakout above the triangle's supply zone could trigger further upside in USDT Dominance, potentially putting additional pressure on the crypto market.
On the other hand, a rejection from the current resistance zone or a breakdown below the cloud support could trigger further downside in USDT Dominance.
Since DXY moves inversely to crypto, this setup could heavily impact upcoming market direction.

64
$BTC /USDT ANALYSIS
Bitcoin has broken down the descending triangle pattern with significant volume, signaling strong bearish momentum.
The Ichimoku cloud is currently acting as a key resistance barrier above the price action, reinforcing the bearish structure.
BTC appears vulnerable to further downside, provided it continues to trade below the broken patter support and the Ichimoku cloud. Keep a close eye on upcoming price action for further developments

t.me/jemin3
Join my tg for me insights and crypto bonuses
2
116
$BTC /USDT ANALYSIS
Bitcoin is rebounding from the support trendline of the descending broadening wedge pattern, showing signs of a potential recovery.
However, BTC is still trading below the 200MA, which is acting as a key resistance barrier.
A solid breakout above the 200MA could strengthen bullish momentum and trigger another upward rally in the market.


$arc /USDT ANALYSIS
ARC is holding above the support trendline of the ascending triangle pattern, keeping the bullish structure intact.
A strong rebound from this support could initiate another upward move, while a solid breakout above the triangle resistance would provide strong bullish confirmation and potentially trigger a significant rally.

3
5
200
Quick Reminder: The BloFin campaign is still live and ongoing!
Up to $1,000 in Futures Bonuses
First 300 eligible users only 🔥
Deposit now:
≥ $100 → $20
≥ $500 → $100
≥ $1,000 → $200
≥ $2,500 → $500
≥ $10,000 → $1,000
Extra: First 300 users get a $10 voucher + VIP 1 for 30 days.
Sign up here 👇
partner.blofin.com/d/Jemi

3
11
603
$VIRTUAL /USDT ANALYSIS
VIRTUAL is rebounding from the support trendline of the triangle pattern, indicating a potential recovery in price action.
However, the Ichimoku cloud is currently acting as a key resistance barrier above the price.
A solid breakout above both the Ichimoku cloud and the triangle resistance would provide strong bullish confirmation and could trigger further upside momentum.
