

Zürich, Schweiz
Joined May 2015
- Tweets5.8K
- Following378
- Followers2.9K
- Likes839




Almost no one is holding gold... just 2.7% of global financial assets!

Almost no one is holding gold... just 2.7% of global financial assets.
Meanwhile:
- Global debt is surging
- US M2 money supply is growing at the fastest pace in 5 yrs
- Almost every major economy is running persistent deficits
- Global bond markets are blowing up
In other words, debt keeps piling up, the money supply keeps expanding and governments need even more debt to service existing debt.
If this were a company, it would go bankrupt.
Governments don't go bankrupt. They devalue the currency and make you pay for their fiscal irresponsibility through inflation.
Gold is the natural insurance against that.
You buy insurance before the crisis.
By the time everyone wants it, the premium, in this case the gold price, has already adjusted.

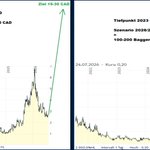
Silver is trading almost 30% below its 200-day moving average. The last time we saw similar levels was March 2020.

Here is a chart to ponder over the weekend.
Silver is trading almost 30% below its 200-day moving average.
The last time we saw similar levels was March 2020.
We are likely approaching another important inflection point for metals and mining.
tavicosta.substack.com/p/top…

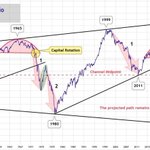
DOW/Gold Ratio: further deterioration in the ratio, with the 2011 low near 5.7:1 representing an important historical reference and next target level!

DOW/Gold Ratio
Nearly a century of wealth rotations between equities and gold.
Three major peaks, dramatic reversals, and a potential fourth phase unfolding.
My thesis anticipates further deterioration in the ratio, with the 2011 low near 5.7:1 representing an important historical reference and next target level.


The Dow/Gold ratio has now broken below secular support!

The $Dow/ $Gold ratio has now broken below secular support and returned to retest it from underneath. That is a concerning development for equities.
If this breakdown holds, it could mark another major step in the long-term rotation of capital away from paper assets and toward gold.
We saw similar structural shifts at previous major market turning points. The next few months could be important.
Not financial advice.

People assume inflation just spikes up, but it comes in waves...
Inflation: Today vs 1970s
People assume inflation just spikes up, but it comes in waves...
With every downward correction, people think the pain is over, just to be smacked in the face by the next inflationary surge.
Those who knew what’s coming made life-changing money, while those who failed to do so lost fortunes.

The U.S. DOLLAR could lose 75% of its purchasing power, and gold could QUADRUPLE in price.

🇺🇸 The U.S. DOLLAR could lose 75% of its purchasing power, and gold could QUADRUPLE in price.
Brandon Weichert spoke with legendary resource investor Rick Rule, who has spent more than 50 years navigating gold markets.
And Rick has a rather uncomfortable prediction for the next decade.
He believes America is heading toward another 1970s-style inflationary crisis, with the dollar potentially losing 75% of its purchasing power.
If he's right, gold could trade at THREE or FOUR TIMES its 2024 price.
But Rick isn't predicting a straight line upward. Higher interest rates could keep gold under pressure in the short term.
We also discussed the recent AI selloff, and Rick made an interesting point about Washington's growing appetite for regulation.
Restricting American data centers won't necessarily stop AI investment. It could simply push construction, and the demand for copper that comes with it, to China or the Gulf.
As for BRICS replacing the dollar? Rick isn't convinced.
He believes American financial dominance will weaken, but sees no credible replacement for the dollar anytime soon.
And his advice for ordinary investors was surprisingly straightforward.
Live below your means, build savings, own some physical gold and invest in your own skills before taking speculative risks.
Rick expects a difficult decade ahead, but he isn't betting against America's ability to recover.
@WeTheBrandon @RealRickRule
The pattern has held for 50+ years.
1974 → 1980: 7 years
1980 → 1987: 8 years
1987 → 1994: 8 years
1994 → 2003: 8 years
2003 → 2008: 7 years
2008 → 12/2015: 8 years
12/2015 → August 2020: Early cycle bottom

Gold moves in 7-to-8 year cycles.
The pattern has held for 50+ years.
1974 → 1980: 7 years
1980 → 1987: 8 years
1987 → 1994: 8 years
1994 → 2003: 8 years
2003 → 2008: 7 years
2008 → 12/2015: 8 years
12/2015 → August 2020: Early cycle bottom
October 2022 marked another early 8-year cycle bottom.
A break of the 2020 all-time high would be STRATEGICALLY OUTRIGHT BULLISH.
THE BIBLICAL ORIGIN
The cycle comes from the Bible story (Genesis 41).
Pharaoh's dream: Seven fat cows and seven lean cows.
Interpretation: Seven years of high yields followed by seven years of famine.
The Egyptians didn't just build pyramids. They predicted financial markets 3,500 years into the future.
WHEN GOLD OUTPERFORMS
Gold works well in times of unrest.
1976-1980 (hyperinflation):
S&P 500: 10.8% p.a.
Gold: 56.3% p.a.
2001-2011 (tech bubble + financial crisis):
S&P 500: 2.4% p.a.
Gold: 20.6% p.a.
After a prolonged sideways movement, gold has now reached a new high.
This is OUTRIGHT BULLISH.
THE SETUP FOR 2026
If we're entering a new cycle, the target by 2028: $15T market cap.
That's a massive leg up from current levels.
THE CASE FOR GOLD MINERS
Most gold companies have restructured.
– Balance sheets cleaned up
– Cost structures streamlined
– Solid free cash flow
– Shareholder-friendly dividends
The scenario that benefits them most?
US recession + Fed cuts rates + gold rallies + fuel prices ease.
Double boost to profits:
1. Rising gold price
2. Falling input costs (fuel)
But as always: Gold mines are a thing of their own.
You either believe in the ancient metal or you don't.
There is nothing in between.
PS: I'm a gold bug.

Silver and gold miners: Their rise will be so powerful and vertical that it will capture the public’s imagination for years to come, setting the market’s next major trend and becoming a permanent magnet for capital, much like Nvidia or Crypto did!

Silver and gold miners are now entering the strongest phase of the bull run that began in 2020, a cycle I believe will extend well beyond 2030.
Their rise will be so powerful and vertical that it will capture the public’s imagination for years to come, setting the market’s next major trend and becoming a permanent magnet for capital, much like Nvidia or Crypto did.
The hardest part will be resisting the urge to sell. When positions go up tenfold in what feels like no time, taking profits will be incredibly tempting. And that's why I haven't sold the correction at the start of this year. I'm in the mindset to harvest the full seeding.

Minimum target $8’800...
Gold Heading into 2-Year Cycle Bottom!
Minimum target $8’800...
... and 5 Gold Miners to Own
Read here: arvymacrocycles.substack.com…

The last commodity cycle began when the dot com bubble bursted... now the AI bubble is bursting
The last commodity cycle began when the dot com bubble bursted... now the AI bubble is bursting
When the dot-com bubble popped, commodities outperformed the S&P 500 by roughly 5x.
The same occurred during the 1970s, when the Nifty Fifty bubble collapsed and commodities surged.
Today, commodities are trading at historic lows relative to equities...
To reach the previous cycle peak, commodities would have to outperform the SP by 8x
The next great rotation will be from equities into commodities.
To put things into perspective, Apple alone is worth ~15 times more than all US commodity ETFs combined.
Just imagine what happens when trillions of dollars start rotating into commodities...
We don't own enough commodities for what's coming

winners were precious metals mining stocks

With all of the major stock market indexes lower this week, the standout winners were precious metals mining stocks. The $GDX surged 9.6%. This is a sign of things to come. A sharp turn to the left, and the higher inflation that will result, will be extremely bullish for gold.


Expectations now for the ratio to run from 13ish down to sub 5.

Another turn now behind us in the Dow/Gold ratio.
Looking back we can see the change after the last bubble burst in 2000 & how the ratio declined from plus 40 to sub 10 over the next decade.
Expectations now for the ratio to run from 13ish down to sub 5.
There's 360 trillion in global debt that needs cleansing.
Market action with stocks into a bear & excessive printing will propel the Dow/Gold ratio much lower.
Physical/Fiat is now trending again.


Miners and large juniors are showing resilience.


