

Turning complex data into powerful visual stories! 📊 Information and #dataviz designer @BaryonDesign. Author of 'Powerful Charts'. Ex-physicist. He/him 🏳️🌈
- Tweets5K
- Following1.2K
- Followers4.2K
- Likes14.2K





ALT Announcement banner for the VIB strategic science communication summer school, organized from 5 to 9 July 2027 in Ghent, Belgium. The tagline is 'How do you communicate your science effectively to different audiences?'. The background is a photo of an audience listening to a speaker on stage in a dimly lit room, on stage is the VIB logo in large white letters.


ALT Dutch-language infographic with PISA 2025 results for Flanders (15-year-olds, science, reading, maths and computational problem solving). Flemish scores have fallen over the long term: science to 496, reading to 467 and maths to 489. Flanders sits above the EU and OECD averages but behind countries like Estonia and England. Further panels cover inequality, gender, school tracks, low reading levels and computational problem solving.


ALT Screenshot of a Microsoft Teams chat from the end of an online workshop, with the messages in Dutch and the senders’ names hidden by grey bars. Between 12:00 and 12:03 on Thursday, twelve participants thank Koen in short messages. Most simply say thanks (“bedankt”, “heel erg bedankt”, “dankjewel”). Several add that the session was interesting (“heel interessant”, “superinteressant”). One says the clear explanation makes them want to start experimenting, another thanks him for the pleasant and clear workshop, and one adds a smiling emoji.


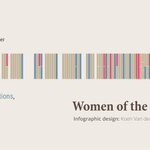
ALT Tall infographic “Women of the Nobel Prize”: six strip charts, one per prize category, showing women laureates in pink among tan bars for men. Since 1901, 935 prizes went to men and only 70 to women. Women’s share ranges from 2.2% in Physics to 15.4% in Literature, and pink bars cluster toward recent decades. In 2026, Anne Carson (Literature) and Navanethem Pillay (Peace) are the two women laureates.

ALT Strip chart of Nobel Peace Prize laureates from 1901 to 2026, with women in pink, organisations in blue and men in tan. Of 144 laureates, 92 are men, 31 are organisations and 21 are women (14.6%). Bertha von Suttner (1905) and Navanethem Pillay (2026) are labeled as the first and most recent women.

ALT Strip chart of Nobel Prize in Economics laureates from 1969 to 2026, with women highlighted in pink among tan bars for men. Of 101 laureates, only 3 are women (3.0%). Elinor Ostrom (2009) and Claudia Goldin (2023) are labeled as the first and most recent.

ALT Infographic titled "Women of the Nobel Prize" showing the Nobel Prize in Literature from 1901 to 2026. Each prize share is drawn as a thin vertical bar: tan for men (104) and pink for women (19, or 15.4%). Pink bars are scattered through the first half of the timeline and become much more frequent from the 1990s onward, with a woman honored in roughly every second or third year in the most recent decades. Two women are labeled with portraits: Selma Lagerlöf in 1909 (prize share 1/1), the first woman in this category, and Anne Carson in 2026 (prize share 1/1), the most recent. Gaps in the bars mark years when no prize was awarded.

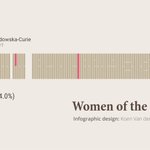
ALT Infographic titled "Women of the Nobel Prize" showing the Nobel Prize in Chemistry from 1901 to 2026. Each prize share is drawn as a thin vertical bar: tan for men (193) and pink for women (8, or 4.0%). Pink bars are sparse: a few in the first half of the timeline, one around the 1960s, and a cluster in the most recent decade or so. Two women are labeled with portraits: Marie Skłodowska-Curie in 1911 (prize share 1/1, the full prize), the first woman in this category, and Carolyn Bertozzi in 2022 (prize share 1/3), the most recent. Gaps in the bars mark years when no prize was awarded.


ALT Infographic titled "Team effort" about the Nobel Prize in Physics. A bar chart shows the number of laureates per year from 1901 to 2026, on a scale from 1 to 3. In the early decades most years have one laureate, with occasional years of two or three. From around the 1950s onward, years with two and three laureates become increasingly common, and a note says the prize has been awarded more and more often to groups of researchers rather than individuals. Two single-laureate years are highlighted in dark brown and labeled with portraits: Georges Charpak in 1992 and Francis Halzen in 2026. The text explains that Halzen's 2026 prize to a single person is unusual, as the last time this happened was 34 years earlier.
ALT Infographic titled "Team effort" about the Nobel Prize in Physics. A bar chart shows the number of laureates per year from 1901 to 2026, on a scale from 1 to 3. In the early decades most years have one laureate, with occasional years of two or three. From around the 1950s onward, years with two and three laureates become increasingly common, and a note says the prize has been awarded more and more often to groups of researchers rather than individuals. Two single-laureate years are highlighted in dark brown and labeled with portraits: Georges Charpak in 1992 and Francis Halzen in 2026. The text explains that Halzen's 2026 prize to a single person is unusual, as the last time this happened was 34 years earlier.

ALT Infographic titled "Women of the Nobel Prize" showing the Nobel Prize in Physics from 1901 to 2026. Each prize share is drawn as a thin vertical bar: tan for men (226) and pink for women (5, or 2.2%). Only five pink bars appear on the whole timeline: one in the early 1900s, one around the 1960s, and three clustered in the last decade or so. Two women are labeled with portraits: Marie Skłodowska-Curie in 1903 (prize share 1/4), the first woman in this category, and Anne L'Huillier in 2023 (prize share 1/3), the most recent. Gaps in the bars mark years when no prize was awarded