

On a mission to master markets and life. Trading stocks with momentum using the Heatseeker & EMA's Linktree - https://xitter.gq/t.co/IGmRHjR6ef
Heatseeker Access 👉🏼
Joined October 2023
- Tweets28.4K
- Following464
- Followers18.5K
- Likes24.6K




On the 22nd of August $IREN - $CIFR both where at all time high institutional ownership yet they both dropped a lot since then.
$CIFR -48%
$IREN -45%
Ownership at new highs, but price dropped...
Well... These Institutional Ownership chart hides something.
You see big increases on the chart, but net ownership increases didn't move that much, but short interest has for $IREN - $CIFR.
That's the thing you need to watch. Did the net ownership rise % wise compared with the chart or did short interest solely increase.

WHAT THE OWNERSHIP CHART HIDES⁉️
$IREN - $CIFR
Institutional ownership charts lie a little actually...
When a fund lends shares to a short seller, both the lender and the new buyer report them. Same share, counted twice.
$IREN: real buying happening here. Shorts at record highs do inflate the chart a bit, but the accumulation underneath is genuine. And with the open ATM this does offset it as well actually.
$CIFR: the jump looks impressive until you check what's behind it. Net shares flat, the founding shareholder sold a third of its position, shorts almost doubled. Not the buying wave the chart suggests.
So you see big increases, but net ownership increases didn't move that much, but short interest has for $IREN - $CIFR. And that is something you need to consider as well.
$CLSK reached +100% institutional ownership earlier this year, why? Because shorts kept doubling down...


TheGentleTraveler retweeted

My working thesis is that the market, particularly across AI and data center infrastructure, is increasingly pricing in the probability of a Democratic sweep in November. If this plays out I suspect much of the political and regulatory uncertainty will have already been discounted by the time we get to the midterms.
My base case is that we establish a bottom ahead of the election, see some consolidation as the results and policy implications are digested, and then enter a much more constructive environment heading into 2027.
The underlying demand for compute and power infrastructure isn't going away, irrespective of who controls Congress. I think the market is conflating near-term political uncertainty with a structural impairment to the LT investment thesis.
Once that uncertainty begins to clear, attention should shift back toward fundamentals, execution, and capital deployment. Assuming liquidity conditions are supportive, I think smaller-cap infrastructure names could be among the biggest beneficiaries of that rotation.
In other words, I suspect the political cycle is influencing the timing of the opportunity far more than its underlying economics. Yes I know yields are higher too...but guess what? Get used to it that's the environment we're in and until economic productivity deteriorates it won't really affect the market as bad as you think (otherwise indexes wouldn't be at ATHs)

I haven’t bought much since they made lower lows.
But them losing last weeks lows gets it very interesting.
Since it moved below $10.60. The $7.50 short gamma was the pull. Has to find a bottom here. But AI sector is being hit hard.
Also got a filing after the close yesterday. Gap at 7.60 also filled again.
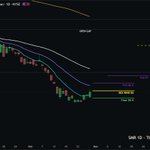
$SMR may have found its floor.
Possible interim low in, with a solid bounce off it reclaiming the 8 EMA.
Now testing the 21 EMA around $6.36, curious if it can find the strength to push through.
Weekly still looks overextended to the downside, so sideways chop feels more likely than a fast move up.

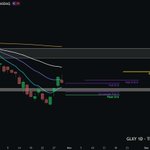
$GLXY already up 30% off the bottom.
Strong bounce off an overextended low, a nice move for anyone who caught it.
But now getting hard rejected at the 21 EMA, and the weekly 8 got rejected yesterday too.
Could chop sideways from here, or find fresh strength, watching this one day by day.

$PLTR coiling tight before a move.
Solid push yesterday, up nearly 3% off the low and testing the weekly 8.
Now running right into the 8 EMA, and price action is getting tight here.
Could be setting up for a move soon, leaning toward upside if it can reclaim the EMAs, and the weekly still looks healthy overall.

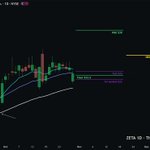
$ZETA stuck between two EMAs.
Tried to reclaim the 21 yesterday but couldn't close above it, despite a decent bounce off the weekly 8.
Could go either way from here, so want to see which direction it picks before calling this one.

$AEHR rejected right at the 8.
Sitting below the EMAs after a failed attempt to reclaim them.
Likely either another leg down or sideways chop for a few weeks, the 8 EMA keeps rejecting every push.
Weekly looks to be in stage 4, so another leg lower is a real possibility.

$NVDA drifting toward a key test.
Lost the 8 EMA and has been battling both the 8 and 21 for a while now.
Most logical spot it heads toward is the 200 MA at $204.28.
Watching closely to see if it bounces there.

$SIDU stuck in the same spot.
No real change over the last couple weeks, still getting rejected at the EMAs every time it tries.
Tried to push above them but just didn't have the strength.
More likely to chop sideways here before any real move up.
