

Crypto/Bitcoin analyst and investor. Using top indicators for accurate predictions for the coming Bullrun. Funny memes to keep it fun.
Joined August 2023
- Tweets12.8K
- Following0
- Followers9.5K
- Likes1.2K

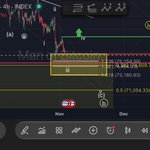


$BTC reached my ideal buy zone and reversed to the upside. I see the move to the downside as a potential wave-iii low.
A decisive break above $78,808 would be the first sign that a local low is in, with price potentially heading toward the descending trendline.

$BTC: It appears that the bulls are not interested in buying at these levels.
That said, the yellow zone highlights where a potential reversal could occur, at least for a wave-iii low.

$BTC reversed to the downside after reacting to key resistance and has now reached a zone that could be interesting for the bulls.
The bulls need to step in here to prevent further downside.

$BTC reacted to key resistance at $78,733.
Ideally, price stays below the last swing high to keep the downside pressure intact.
A decisive break above resistance would suggest that a more complex correction is unfolding, potentially leading to a retest of the descending trendline.

$BTC: The reversal from the 100% Fib extension level is weak, with price facing resistance at the channel’s lower boundary.
Next week should give us more clarity on the direction.
👉Key resistance: $78,733
👉Next downside target: $75,154

$BTC: The white roadmap remains my preferred scenario. I’m keeping the yellow roadmap on the chart because it is still technically valid.
As long as price remains below $78,733, I expect at least one more low.

$BTC: I have added a channel to the chart. A retest from below could send price toward the next downside target at the 1.236 Fib extension, the minimum requirement for a third wave.
As long as price remains below $78,733, I expect lower prices.

$BTC: As long as price remains below $78,733, my preferred roadmap is the white one.
The ideal target for wave-iii is the 1.38 Fib extension at $74,388.

$BTC: As mentioned yesterday, the ascending trendline was key. Price broke below it and dropped sharply.
👉Bears need to keep price below $78,733 to maintain downside pressure.
📉A break above this level would suggest a more complex correction is unfolding.

$BTC: A perfect example of how important support levels are and how breaking below them can trigger a sharp drop.
A break below the ascending trendline would be the first sign that wave-iii is unfolding to the downside. A break below $79,153 would confirm this further.

$BTC: Micro support for trend continuation to the upside is at $80,954.
👉A break below this level would make $80,323 the next key level to watch.
⚠️A break below $80,323 would suggest that the pattern is breaking to the downside.

$BTC: Wave-2 may have already topped. A sustained break below $80,577 would provide further confirmation.
As long as price remains above this level, another high in wave-5 remains on the table.

$BTC: Since my last update, price has moved sideways and is now getting squeezed between support and the trendline.
The key level to keep the upside momentum intact is $79,153.
My preferred scenario is a wave-c of 2 to the upside before price continues lower.

$BTC: The move to the downside could be a wave-1 or part of wave-3.
On the 5-min chart, I can identify a small 5-wave pattern to the upside, suggesting that a larger ABC correction to the upside is likely.
Key support is between $80,273 and $79,547.

$BTC: The price is breaking out for at least a bounce. A hourly close above the trendline would confirm this breakout further.

$BTC retested the trendline from below and reversed to the downside. Wave-2 may have topped, with wave-3 now unfolding to the downside.
For now, I’m watching for a bounce, either a small one before trend continuation to the downside or a higher bounce into the resistance area.

$BTC: It could be that wave-1 has already bottomed out. Resistance for a wave-2 high is between $81,790 - $83,313.
The price is currently testing the trendline from below.

$BTC: Still no sign of a low. An impulsive move to the upside breaking above $84,862 would suggest that a more bullish scenario is playing out.

$BTC: The corrective move to the upside experienced a sharp decline and has broken below micro support, which suggests that a top of sorts is in.
Key resistance is now located at $84,862.

$BTC: KEY level to watch in this chart is the $87,404 price level.
As long as the price remains below this level, the orange scenario is still on the table.
