

SME investing minus the circus. IPOs, OFS & business models. Market survivor. Not SEBI registered—just trying to be less wrong than yesterday.
India
Joined November 2013
- Tweets1K
- Following4
- Followers858
- Likes1.3K
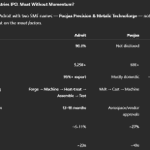
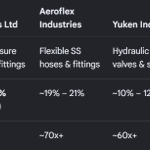

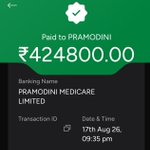





BLA vs SFC vs EAAA 😂📊
IPO subscriptions are teaching one lesson: in the short term, GMP can sometimes speak louder than the RHP!
If someone put a gun to my head and asked me to rank these three purely on business fundamentals, **BLA would come last on my list.** 😅
But markets are a democracy! 🗳️ The public votes with its money, and the market decides the winner. My job is to analyse, not argue with the voters! 😂
*Disclaimer: Personal views based on publicly available information. Not SEBI-registered. Not an investment recommendation. IPO investments carry risks; DYDD.*
Tracking the SFC Environmental Technologies IPO closing today.
Key points: Dominant market player (>80% segment share), exclusive DuPont tie-up, strong institutional anchors (89% Mutual Funds). Tradeoffs: Weak retail bidding momentum and a stretched working capital cycle (~282 days to collect receivables)
Disclosure: Educational analysis only, not financial advice. I am applying personally; views may be biased. Please do your own research or consult a SEBI-registered advisor before investing.

SFC Environmental IPO: High Moat, Trapped Cash? 💧
• The Moat: Commands a dominant 80%+ India market share in Sequencing Batch Reactor (SBR) sewage technology. Exclusive DuPont tech partnership creates massive entry barriers.
• The Numbers: Stellar 19.5% PAT margins outclassing traditional engineering peers (Ion Exchange trades at ~50x P/E). Offering is priced at a reasonable ~20.9x post-IPO P/E.
• The Catch: Highly cash-strapped operations. Trade receivables sit at a painful 282 days, dragging FY26 Cash Flow from Operations into the negative (-₹25.80 Cr).
Strong technical runway with a 2.1x book-to-bill visibility, but allocation is heavily tied down by municipal working capital delays.
Disclaimer: For informational purposes only. Not financial advice or an endorsement to buy or sell securities. Investing in IPOs carries substantial market risk. Please consult a SEBI-registered advisor before investing.
MIT Engineers retweeted
SFC Environmental IPO: High Moat, Trapped Cash? 💧
• The Moat: Commands a dominant 80%+ India market share in Sequencing Batch Reactor (SBR) sewage technology. Exclusive DuPont tech partnership creates massive entry barriers.
• The Numbers: Stellar 19.5% PAT margins outclassing traditional engineering peers (Ion Exchange trades at ~50x P/E). Offering is priced at a reasonable ~20.9x post-IPO P/E.
• The Catch: Highly cash-strapped operations. Trade receivables sit at a painful 282 days, dragging FY26 Cash Flow from Operations into the negative (-₹25.80 Cr).
Strong technical runway with a 2.1x book-to-bill visibility, but allocation is heavily tied down by municipal working capital delays.
Disclaimer: For informational purposes only. Not financial advice or an endorsement to buy or sell securities. Investing in IPOs carries substantial market risk. Please consult a SEBI-registered advisor before investing.
Why I Am Writing This: The Zetwerk Manufacturing Phenomenon 🏭🔥
I am sharing this because in an era crowded with crony capitalism and fragile, cash-burning apps, the nation needs to see what true Indian grit looks like.
In 2018, Amrit Acharya hit the US H1B visa wall at McKinsey. Instead of fighting the system, he packed his bags, returned home, and teamed up with Srinath Ramakkrushnan to wage war on the chaotic, grease-stained floors of Indian manufacturing.
They raised VC cash and immediately built a total dud—a slick software tool. But factory floors don’t care about software. When clients told them, "We don’t want to track delays, we want our damn parts," they didn't panic. They ripped up the SaaS blueprint and pivoted into a managed marketplace, putting their own necks on the line for quality and deadlines.
Instead of spending billions building physical factories, they built the asset-light Zetwerk OS, weaponising thousands of underutilised small-town MSMEs. When the global "China+1" wave hit, they were ready.
Today, following a blockbuster public IPO, they are virtually debt-free, sitting on a massive multi-thousand-crore cash war chest with a ₹26,000 Crore valuation.
These founders are in their 30s. They got their boots dirty, made mistakes, pivoted, and built a true Swadesh empire. They deserve to be the absolute poster boys of our industry. This is the hope India needs! 🇮🇳
Why are Big Institutions (QIBs) Rushing into the EAAA IPO Despite High Valuations? 🤔
What I gathered on the street today about why there is such good demand from QIBs for the EAAA IPO—just sharing what I found to help understand the institutional mindset: 👇
1. The Scarcity Premium 💎
EAAA is India's first listed pure-play alternative asset manager. While traditional retail AMCs face regular SEBI fee cuts and sudden redemptions, EAAA manages institutional money locked in for 4–10 years. QIBs value that highly secure, predictable revenue stream.
2. The Forward Valuation Play 📈
Trailing P/E looks steep at ~41x, but institutions are pricing future earnings. Annualising their massive Q1 FY27 growth drops the forward P/E to ~33.3x. At that level, it actually trades at a discount to India’s average listed wealth managers (~40x P/E).
3. Hyper-Scalable Structure ⚡
Alternative asset managers scale beautifully. EAAA brought in an incremental ₹20,380 crore in AUM just in Q1 FY27 (taking total AUM to ₹95,345 crore). Because the core operational team is already built, this massive new fee pool drops straight to the bottom line.
4. Direct Product Alignment 🤝
Global pension funds and insurance firms are already the main buyers of EAAA's InvIT slices to capture Indian infrastructure yields. Owning equity in the asset manager lets them own the "toll booth" that controls the whole pipeline.
5-The Long Horizon Play ⏳
Institutions don't think like retail investors. While retail looks for quick listing gains, institutions invest with a 5 to 10+ year horizon. They are looking to match long-term liabilities (like pension payouts) with EAAA's predictable, multi-year asset lifecycles.
SEBI Disclaimer: Investment in securities market are subject to market risks. Read all the related documents carefully before investing. not a SEBI-registered investment advisor; this thread is strictly for educational purposes and sharing findings.
Zetwerk: Our Desi Young Boys Are Rocking! 🚀
Zetwerk Manufacturing Businesses Ltd. is up nearly 13% today! 🔥All time high
Our homegrown young entrepreneurs are building a unique global manufacturing platform. Now the market is beginning to understand the business behind the name.
Desi talent. Global ambition. Indian manufacturing!
ZETWERK IPO: NO DIRECT PEER — INDUSTRIAL DISRUPTOR OR VALUATION TRAP? 🏭📊
Zetwerk is not merely a manufacturing company. It is building a technology-led B2B manufacturing ecosystem with a differentiated business model.
🔹 PROMOTERS: First-generation entrepreneurs in their mid-30s, potentially combining experience, energy and a long execution runway.
🔹 UNIQUE BUSINESS MODEL: B2B platform + 800+ engineers + asset-light MSME manufacturing network + selective in-house factory infrastructure.
🔹 HOW IT WORKS: A data-centre company needs transformers. Zetwerk's engineers understand specifications, design the solution, allocate production to suitable manufacturing partners and manage execution. Complex processes can be handled in its own facilities.
📈 SCALE: FY26 revenue reportedly reached ₹15,913 crore, up 40.4%. Adjusted EBITDA: ₹421 crore. Reported net loss: ₹1,606 crore.
💥 WHY WAS THE FY26 LOSS SO LARGE?
The headline loss needs to be examined beyond operating performance:
Non-cash ESOP/share-based compensation: Approximately ₹800 crore of founder and employee share-based charges reportedly weighed on reported earnings. These are non-cash accounting expenses in the period, although equity compensation has an economic cost through dilution.
Civil infrastructure exit: A reported ₹450 crore write-down associated with exiting legacy civil infrastructure operations added to the loss.
Low-margin metal trading: Ring-fencing the low-margin commodity-sourcing business, reportedly operating at around 1.24% EBITDA margin, could improve transparency and focus on higher-value manufacturing. It does not automatically eliminate the underlying economic risks.
These items may explain a substantial part of the loss, but the entire ₹1,606 crore loss should not be dismissed as unreal. Recurring expenses, finance costs and cash-flow performance still matter.
💰 THE FY27 TURNAROUND THESIS
Projected FY27 PAT: ₹180–250 crore — an estimate, not a certainty.
1️⃣ Debt reduction: Approximately ₹2,160 crore of IPO proceeds is earmarked for debt repayment, potentially reducing interest costs.
2️⃣ Operating leverage: Projected adjusted EBITDA of ₹580–620 crore, assuming revenue growth and execution improvements.
3️⃣ Lower exceptional charges: FY26's civil infrastructure write-down may not recur at the same level, although future ESOP expenses and other charges remain possible.
Illustrative bridge: ₹580–620 crore adjusted EBITDA, less ₹110–130 crore finance costs, ₹180–200 crore depreciation and other charges, and ₹30–50 crore estimated tax, supports a potential positive PAT—subject to actual accounting and tax treatment.
🔍 POTENTIAL PEER FRAMEWORK — NOT DIRECT COMPARABLES
Dixon Technologies: A reference point for the EMS/manufacturing side of the business.
Delhivery: A reference point for the technology-led platform-plus-infrastructure side.
Zetwerk sits somewhere between these two business architectures. It combines engineering-led custom manufacturing, a distributed MSME partner ecosystem and selective owned production infrastructure. There is no obvious like-for-like listed global peer.
🎯 WHO SHOULD CONSIDER THIS IPO?
In my view, this may not be suitable for retail investors with limited funds or low risk tolerance. It may interest HNIs and financially sophisticated investors who understand the business, can tolerate substantial volatility and are willing to underwrite a differentiated but still unproven profitability trajectory.
A three-year investment thesis would rest on successful debt reduction, sustained growth, improving margins and conversion of EBITDA into PAT and operating cash flow. This is a high-risk thesis—not a guaranteed three-year wealth creator.
MY TAKE: A potentially unique industrial platform with considerable upside if execution succeeds, but valuation, working capital and profitability remain the critical tests.
DISCLAIMER — FOR SEBI COMPLIANCE: This post is for educational and informational purposes only. It is not investment advice, a research report, a buy/sell recommendation or a solicitation to invest. The views expressed are analytical opinions, not a recommendation to any specific investor category. All financial figures and projections require independent verification against the RHP, audited financial statements and stock-exchange disclosures. Forward-looking estimates are uncertain and actual outcomes may differ materially. No assurance of returns or profitability is given. Investors should assess their own financial circumstances, risk tolerance and investment horizon and consult a SEBI-registered investment adviser where appropriate. Securities investments are subject to market risks, including possible loss of capital.
SFC Environmental IPO: High Moat, Trapped Cash? 💧
• The Moat: Commands a dominant 80%+ India market share in Sequencing Batch Reactor (SBR) sewage technology. Exclusive DuPont tech partnership creates massive entry barriers.
• The Numbers: Stellar 19.5% PAT margins outclassing traditional engineering peers (Ion Exchange trades at ~50x P/E). Offering is priced at a reasonable ~20.9x post-IPO P/E.
• The Catch: Highly cash-strapped operations. Trade receivables sit at a painful 282 days, dragging FY26 Cash Flow from Operations into the negative (-₹25.80 Cr).
Strong technical runway with a 2.1x book-to-bill visibility, but allocation is heavily tied down by municipal working capital delays.
Disclaimer: For informational purposes only. Not financial advice or an endorsement to buy or sell securities. Investing in IPOs carries substantial market risk. Please consult a SEBI-registered advisor before investing.
EAAA IPO:
Ever wondered how global giants like Blackstone make money? India is getting its first pure-play alternative asset manager IPO this week: EAAA India Alternatives.
Here is the ultimate breakdown of their business engine, peer valuations, and hidden risks: 👇
🏗️ 1. The Business Model
• Asset Assembly: They buy massive infrastructure projects (solar grids, toll roads, IT parks).
• Syndication: They package these assets into "slices" (InvITs/AIFs) for yield-hungry global pension funds.
• The Extra Reward: If they beat their promised target yield (e.g., hitting 13% instead of 9%), they pocket a massive performance bonus called Carried Interest.
. The Peer Valuation Matrix
Because EAAA handles long-duration alternative assets rather than volatile mutual funds, it commands an aggressive premium pricing structure.
EntityP/E RatioReturn on Equity (ROE)
EAAA India (IPO Cap)41.25x25.0%
HDFC AMC (India)~38.5x29.2%
Nippon Life AMC (India)~36.2x28.1%
Blackstone Inc. (Global)~32.4x24.1%
KKR & Co. Inc. (Global)~28.6x21.3%
⚠️ 3. Hidden Risks Other Investors Miss
• Negative Operating Cash Flow: Profits look phenomenal on paper, but actual cash is locked up in long-term asset valuations.
• 100% Offer for Sale (OFS): The entire ₹1,200 crore proceeds go straight to the promoters—zero fresh capital enters the company.
• Overhead Cost Drag: Keeping top fund managers is highly expensive, pushing their cost-to-income ratio to 68.5% in Q1 FY27.
⚖️
Buying the EAAA IPO means buying a slice of a management platform, not the physical assets themselves. While the operational engine is highly scalable, the 41.25x P/E ask leaves minimal margin of safety for retail public investors.
SEBI Disclaimer: Investment in securities market are subject to market risks. Read all the related documents carefully before investing. The creator is not a SEBI-registered investment advisor; this thread is strictly for educational purposes.
BLS Polymers IPO Investment Note: Key Insights 🧵
• The Margin Illusion: Net Profit (PAT) skyrocketed 259% (FY24-26) while revenues stalled at just 17.9% growth. This growth is entirely margin-driven due to dropping raw material costs, not higher sales volumes.
• Working Capital Trap: Cash Flow from Operations (CFO) was just ₹2.68 Cr in FY25 against a PAT of ₹21.14 Cr. Infrastructure clients stretch payment cycles, leading to high receivables and negative CFO in Q1 FY27. This explains why ₹89.50 Cr of IPO proceeds is going straight to working capital.
• Capacity Expansion: The Goa facility operates at 35,251 MTPA. Management is spending ₹77.56 Cr of the fresh issue to expand capacity, with new production lines expected to contribute to the top line within 12 to 18 months post-allotment.
• Crude Oil Vulnerability: Core raw materials (resins/plasticizers) are heavily tied to global oil cycles. Any spike in crude prices squeezes gross margins due to a 3-to-6-month time lag in passing costs to infrastructure buyers.
• Does a Moat Exist? The high net block turnover proves low entry barriers; any peer can replicate the setup with minimal capital. However, a micro-moat exists via 127 customized polymer grades that enjoy formal government/PSE enlistment, driving a 93.92% repeat customer rate.
• Promoter Skin in the Game: The IPO is a 100% fresh issue (₹255 Cr) with zero Offer for Sale (OFS). Promoters are not selling a single share, retaining a robust 71.53% post-listing stake.
• Valuation Stretch: At the upper band of ₹150, the implied P/E sits at ~25.04x. This is a massive premium compared to pure-play compounding giants like DDev Plastiks (trading around ~13x P/E), leaving little room for execution errors.
Disclaimer: For educational purposes only. Not financial or investment advice. IPO investing carries high market risk. Please consult a SEBI-registered financial advisor before making any investment decisions.
Yali Deeptech Fund locked in a massive 4.2x return on its investment in Tonbo Imaging, selling 24 lakh shares at an average price of ₹1,069.22 on listing day vs an acquisition cost of ₹250.
How did they exit instantly on Day 1? 🕵️♂️
Under Regulation 17 of SEBI’s ICDR Regulations, the standard 6-month post-IPO lock-in for pre-issue capital does not apply to SEBI-registered Category I & II AIFs—provided they held the shares for at least 6 months before filing the RHP.
Yali held their stake since March 2025, meeting the criteria perfectly and allowing them to legally liquidate their position directly into market hours. This massive institutional supply explains why listing day delivery volumes easily outpaced the actual IPO float.
Tonbo Imaging: Bumper Listing, But Selling Pressure?
Post-IPO promoter holding: ~14% (down from 17.43%).
FY24–FY26 revenue CAGR: **~-8%** — sales fell from ₹428cr to ₹363cr.
Yali Deeptech Fund reportedly sold 24L shares at avg. ₹1,069 vs ₹250 acquisition cost.
Promoters have already diluted. AIFs and early investors are cashing out. **Who absorbs the next wave of selling?**
*Personal observation, not investment advice. Figures based on IPO disclosures and reported trades; DYDD.*
🔍
Tonbo Imaging is launching an ₹852.18 Cr IPO (100% OFS).
While its ITAR-free electro-optics tech is highly advanced, Here is a breakdown of the key factors.
👇Tonbo Imaging India IPO Investment Note
📊 The Core Metrics:
• Peer Comparison: Revenue fell 22.7% & PAT dropped 30.1% in FY26. Pure-play defense peers (Data Patterns, Paras) show much stronger growth.
• Promoter Stake: Founders hold just 17.43% pre-IPO, dropping to ~14.6% post-IPO. Extremely low "skin in the game".
• Asset Efficiency: Asset-light model means outsourcing assembly to contract manufacturers. Net Fixed Asset Turnover is high at 14.6x, but working capital stretched to a massive 517 days.
3/3 ⚠️ Valuation & Order Book:
• Order Book: Stood at ₹314.24 Cr—only 0.87x of FY26 revenue, providing weak visibility.
• Valuation: Priced at ₹665–₹700, translating to a steep 78.83x P/E on FY26 earnings.
• Recent Trend: Slipped into a net loss of -₹17.74 Cr in Q1 FY27.
(Disclaimer: This is a personal investment note for educational/informational purposes only. Not financial advice. Please consult a SEBI-registered advisor before investing.)
IPO Valuation Critique: Paras Healthcare 🩺🚨
(Educational Review Only. Not a SEBI Registered Investment Advisor. Views are personal based on public RHP data. No buy/sell recommendation.)
Don't let merchant bankers trap retail money in another overvalued IPO. The "cheap" 37x annualised P/E is a complete illusion:
Accounting Glitch? ₹16.2 Cr of Q1 profit is a one-time "deferred tax credit"—not cash from treating patients.
The Cash Trap: Government schemes make up 43% of revenue, locking cash in massive 86-day receivable delays.
Massive Attrition: A staggering 60%+ staff turnover risks operational quality and escalates costs.
PE Exit : 65% of the issue (₹950 Cr) is an OFS for Creador PE to dump shares at peak valuation.
The Mismatch (True Operational Trailing P/E):
Paras Healthcare: 171.06x 🚨 (Tier-2/3 heavy)
Medanta (Global Health): 64.46x
Max Healthcare: 62.10x
Mutual funds are absorbing this overvaluation with public SIP liquidity because it’s "other people's money"—just like recent post-listing crashes. Protect your capital. 🛑📉
(LEGAL DISCLAIMER: Under Section 3(1) of SEBI (Research Analysts) Regulations, 2014, the author clarifies that this post is strictly for general educational/informational purposes and does not constitute financial, investment, or legal advice. The author holds no financial interest or position in the upcoming IPO. Investors must consult a certified financial advisor before taking any market exposure.)
**Zetwerk: 5% Listing Gain in a Weak Market! 🇮🇳**
Even in a poor market, Zetwerk delivered a 5% listing gain. The market appreciated our own entrepreneurs who built a world-first, unique manufacturing platform.
Congratulations to everyone who applied, received an allotment and made a decent listing gain!
A reminder that **unique businesses with a compelling story can still earn market appreciation, even in difficult conditions.**
*Personal observation, not investment advice. DYDD.*
ZETWERK IPO: NO DIRECT PEER — INDUSTRIAL DISRUPTOR OR VALUATION TRAP? 🏭📊
Zetwerk is not merely a manufacturing company. It is building a technology-led B2B manufacturing ecosystem with a differentiated business model.
🔹 PROMOTERS: First-generation entrepreneurs in their mid-30s, potentially combining experience, energy and a long execution runway.
🔹 UNIQUE BUSINESS MODEL: B2B platform + 800+ engineers + asset-light MSME manufacturing network + selective in-house factory infrastructure.
🔹 HOW IT WORKS: A data-centre company needs transformers. Zetwerk's engineers understand specifications, design the solution, allocate production to suitable manufacturing partners and manage execution. Complex processes can be handled in its own facilities.
📈 SCALE: FY26 revenue reportedly reached ₹15,913 crore, up 40.4%. Adjusted EBITDA: ₹421 crore. Reported net loss: ₹1,606 crore.
💥 WHY WAS THE FY26 LOSS SO LARGE?
The headline loss needs to be examined beyond operating performance:
Non-cash ESOP/share-based compensation: Approximately ₹800 crore of founder and employee share-based charges reportedly weighed on reported earnings. These are non-cash accounting expenses in the period, although equity compensation has an economic cost through dilution.
Civil infrastructure exit: A reported ₹450 crore write-down associated with exiting legacy civil infrastructure operations added to the loss.
Low-margin metal trading: Ring-fencing the low-margin commodity-sourcing business, reportedly operating at around 1.24% EBITDA margin, could improve transparency and focus on higher-value manufacturing. It does not automatically eliminate the underlying economic risks.
These items may explain a substantial part of the loss, but the entire ₹1,606 crore loss should not be dismissed as unreal. Recurring expenses, finance costs and cash-flow performance still matter.
💰 THE FY27 TURNAROUND THESIS
Projected FY27 PAT: ₹180–250 crore — an estimate, not a certainty.
1️⃣ Debt reduction: Approximately ₹2,160 crore of IPO proceeds is earmarked for debt repayment, potentially reducing interest costs.
2️⃣ Operating leverage: Projected adjusted EBITDA of ₹580–620 crore, assuming revenue growth and execution improvements.
3️⃣ Lower exceptional charges: FY26's civil infrastructure write-down may not recur at the same level, although future ESOP expenses and other charges remain possible.
Illustrative bridge: ₹580–620 crore adjusted EBITDA, less ₹110–130 crore finance costs, ₹180–200 crore depreciation and other charges, and ₹30–50 crore estimated tax, supports a potential positive PAT—subject to actual accounting and tax treatment.
🔍 POTENTIAL PEER FRAMEWORK — NOT DIRECT COMPARABLES
Dixon Technologies: A reference point for the EMS/manufacturing side of the business.
Delhivery: A reference point for the technology-led platform-plus-infrastructure side.
Zetwerk sits somewhere between these two business architectures. It combines engineering-led custom manufacturing, a distributed MSME partner ecosystem and selective owned production infrastructure. There is no obvious like-for-like listed global peer.
🎯 WHO SHOULD CONSIDER THIS IPO?
In my view, this may not be suitable for retail investors with limited funds or low risk tolerance. It may interest HNIs and financially sophisticated investors who understand the business, can tolerate substantial volatility and are willing to underwrite a differentiated but still unproven profitability trajectory.
A three-year investment thesis would rest on successful debt reduction, sustained growth, improving margins and conversion of EBITDA into PAT and operating cash flow. This is a high-risk thesis—not a guaranteed three-year wealth creator.
MY TAKE: A potentially unique industrial platform with considerable upside if execution succeeds, but valuation, working capital and profitability remain the critical tests.
DISCLAIMER — FOR SEBI COMPLIANCE: This post is for educational and informational purposes only. It is not investment advice, a research report, a buy/sell recommendation or a solicitation to invest. The views expressed are analytical opinions, not a recommendation to any specific investor category. All financial figures and projections require independent verification against the RHP, audited financial statements and stock-exchange disclosures. Forward-looking estimates are uncertain and actual outcomes may differ materially. No assurance of returns or profitability is given. Investors should assess their own financial circumstances, risk tolerance and investment horizon and consult a SEBI-registered investment adviser where appropriate. Securities investments are subject to market risks, including possible loss of capital.
**Bonfiglioli Transmissions: Flat Listing, No Surprise.**
But where is the growth, my Italian friends?
At around 75% capacity utilisation, why no meaningful capacity expansion? If the growth opportunity is so attractive, why is the IPO largely an OFS?
India is not a cash-out destination for foreign promoters.
Nirmalaji Market did its job today: **no listing pop, no easy exit premium.** A reminder that Indian investors are looking beyond a foreign brand name.
Good business? Maybe. But show us the growth, the capex and the skin in the game.
Disclaimer: Personal observation, not investment advice. Not SEBI registered. DYDD.
Bonfiglioli Transmissions IPO Deep-Dive: Financial Marvel or Promoter Cash-Out? 🚨
🐂 The Bull Case: An Asset-Light Engineering Powerhouse
Unmatched Machine Efficiency: Boasts a spectacular Fixed Asset Turnover of 7.2x—vastly outperforming the industrial engineering average of ~4.0x due to a highly optimized, localized assembly model.
Premium Returns: The business commands a stellar 34% ROCE and strong operating margins that expanded to 19.8% in H1CY26.
Production Headroom: Operates at ~75% capacity utilization, giving it plenty of room to scale without requiring immediate, heavy capital expenditure.
🐻 The Bear Case: The Working Capital & Governance Friction
. The real bottleneck isn't factory capacity—it is a sluggish Working Capital Cycle locked up in high inventory days (~90 days) and long debtor cycles (~80 days) dictated by powerful OEM clients.The Turnover Illusion: While fixed asset turnover is great, the Total Asset Turnover drops to 1.51x
Zero Growth Capital: The issue is a 100% Offer for Sale (OFS). The entire ₹2,533 Cr goes straight to the Italian promoters. The company receives ₹0 to support its ballooning working capital needs as it expands.
🔍 The Hidden Risk Everyone is Ignoring: The Royalty Drain
High Promoter Outflow: Bonfiglioli India pays a steep 4.5% annual royalty to its Italian parent—up from 4.2% in CY22.
Peer Comparison: Standard MNC peers listed in India (like Bosch, ABB, and Schaeffler) typically cap parent royalties between 2% to 3%.
The Reality: This 4.5% rate siphons roughly ₹90 Cr annually out of the Indian listed entity. Because the parent is using this IPO to extract capital rather than invest it, any future upward revisions to this royalty agreement present a silent dilution risk for public shareholders.
At a forward P/E of 37.07x, it is priced reasonably against the industry average (51.61x), but investors must weigh excellent operating efficiency against structural cash extraction.
⚠️ SEBI Disclaimer: I am not a SEBI registered investment advisor. This analysis is purely for educational and informational purposes based on the Red Herring Prospectus (RHP) and publicly available broker notes. This is not financial advice or a recommendation to buy, sell, or subscribe to the IPO. Please consult a certified financial advisor before making any investment decisions.
Growth Doesn’t Wait for a Bull Market: Supreme Power & Kheria Autocorp
Supreme Power Equipment up nearly 10% and Kheria Autocorp up almost 17%!
What stands out? Growth, capacity expansion and management guidance—even when market sentiment is weak.
Supreme Power Equipment
🔹 FY27 revenue guidance raised to ₹300–350 Cr from ₹250–300 Cr.
🔹 Peak revenue of ₹550–600 Cr pulled forward to FY28 from FY29.
🔹 Order book at ₹565.8 Cr, with 75–78% in power transformers.
🔹 PAT margin guidance of 9–12%.
Kheria Autocorp
🔹 H1 FY27 revenue of ₹72.27 Cr, up 31.38% YoY.
🔹 Existing capacity utilisation at 98.9%.
🔹 Planned 2,400 MTPA capacity addition at Sanand-II.
🔹 Commercial production guided for January 2027.
The lesson: When companies deliver growth, raise guidance and lay out a credible capex roadmap, the market can take notice—even in a weak environment.
But guidance is not delivery. Plant ramp-up, timely execution and sustainable margins remain the key tests.
Disclaimer: Personal observations for educational purposes only. Not SEBI registered. Not investment advice or a recommendation to buy or sell. I may hold or trade these stocks; my views may be biased. DYDD.THIS ARE COMPANY NOTIFICATIONS TO EXCHANGES AND CONCALL TRANSCRIPT