

The only infinitely scalable, instantly deployable, privacy-first occupancy monitoring solution.
Joined October 2020
- Tweets637
- Following91
- Followers66
- Likes44





That's a wrap on IFMA World Workplace 2026 in Anaheim!
Three days with the people who run offices, campuses and public buildings, and one question we heard over and over: how full are our buildings, really?
A few highlights:
The talk. Nic Halverson and Matt Boyd presented "The Cost of Guessing" in the Innovation Arena to about 40 facility leaders. When the QR code for the GSA evaluation of Occuspace went up, so many phones came out that Matt had to hold the slide.
The booth. Thank you to everyone who stopped by to talk space, data and AI. Our octopus plushies (we call them Octis) were gone by day two.
The dinner. Thank you to everyone who joined us Thursday night. Great food, even better company.
The main stage. B.J. Novak of The Office opened the show (fitting for a room full of people who run offices), and Duncan Wardle, Disney's former Head of Innovation and Creativity, challenged FMs to rethink how they'll compete in a decade of AI.
Missed our talk? Here's the short version.
Ask how full the average office is, and the answer depends on what you measure:
95% by assigned seats
80% by room bookings
76% by badge swipes
52% by counting the people actually there, at the busiest moment of the week
Want the slides? Comment "slides" and we'll send them over. Or grab 15 minutes with our team: hubs.la/Q04FYL5y0
Big thanks to IFMA and the whole World Workplace team, especially Clarissa Arguelles and Diana Maldonado, CEM, for a fantastic week. To JLL and CBRE, whose research helped shape our talk. And to our crew: Nic Halverson, Matthew Boyd, Alex Meyer, Cole DeNormandie, and Danny Moore, who packed and shipped the whole booth. See you next year!


1
28
Put this group in a room and you’ve got more than half a century of experience figuring out how buildings actually get used.
Which means we’ve heard every version of the same questions.
🏢 How much space do we really need?
💰 What is this building costing us compared to how much anyone uses it?
🏗️ Do we actually need to build, or are we just guessing?
Most people are answering those without good data. Honestly, that’s the whole reason we started doing this.
We spent the start of the week together planning 2027, and it was a good one. Lots of ideas, a lot of laughing, not enough sleep.
Now we’re in Anaheim for IFMA World Workplace through Friday.
If you’re here, come say hi. We’d love to hear what’s going on with your space, even if it’s just over coffee.
Not at IFMA this year? We’d still love to talk → hubs.la/Q04FQkyS0

1
11
Today at 12:45 PM PT, Matt Boyd and Nic Halverson take the Innovation Arena stage at @IFMA World Workplace.
How full is your office? Depends who you ask:
95% by assigned headcount
80% by room bookings
76% by badge swipes
52% by sensors counting the people actually there, at the busiest moment of the week
Leases, cleaning, HVAC and food budgets get built on one of those numbers. Usually not the last one.
AI raises the stakes. 90% of organizations plan to use it for real estate decisions, but only 7% rate their occupancy data as excellent (@JLL). AI will give you a confident answer either way.
In "The Cost of Guessing" we'll cover:
- What our H1 2026 data shows (Monday now looks like Friday)
- Real results from @UCLA, @UCSanDiego and a healthcare campus
- Five moves FM teams can make for their 2027 plans
Innovation Arena on the expo floor, 12:45 to 1:45 PM PT. Then come find us at Booth #935.
#IFMA #WorldWorkplace #FacilityManagement #OccupancyData #WorkplaceStrategy

19
78% of the time a conference room is in use, it’s holding two people or fewer. When in use, even the largest spaces are occupied by just 1 or two people 62% of the time
So the question isn’t how many conference rooms you have. It’s whether they’re the right ones.
That’s one of the findings in Issue 03 of Dwell Time, our monthly newsletter on how buildings get measured, understood, and managed.
Also inside:
The Shift: @LorenBrown on why badge data isn’t utilization data, and the $1M office that sat nearly empty
From the Field: what GSA found when it compared occupancy sensors with manual counts, laptop logins, and PIV card swipes
Worth Reading: @AllworkSpace, @JLL, @Johnson Controls, and @Will Walsh
Read Issue 03 and subscribe: hubs.la/Q04FxKqS0

9
This week we're in Anaheim for IFMA World Workplace 2026, and we'd love to see you there.
📍 Booth #935, Wed Nov 18 and Thu Nov 19. Come meet Nic Halverson, Matt Boyd, Alex Meyer and Cole DeNormandie, and see live occupancy data on our touchscreen.
🎤 Wed Nov 18, 12:45 PM PT, Innovation Arena. Nic and Matt present "The Cost of Guessing: How FM Teams Use Occupancy Data to Cut Costs and Get AI-Ready." Badge swipes say the office is 76% full. Sensors say the real weekly peak is 52%. They'll show what that gap costs, and why it matters before FM teams bring in AI.
Want 15 minutes with our team? Book a time: hubs.la/Q04Frq380
#IFMA #WorldWorkplace #FacilityManagement #WorkplaceStrategy #OccupancyData

1
77
Conference rooms are sitting empty. And even when they're occupied, they're often underused.
Occuspace's latest Space Utilization Index shows a clear mismatch between conference room capacity and how people actually use these spaces.
During our recent webinar with @JLL, Enid Maran, Occuspace's Head of Customer Success, highlighted two findings:
⏳ 3.75 hours a day: The average time conference rooms sit completely empty.
👤 78%: The share of occupied conference-room time involving just one or two people — even across rooms designed for much larger groups.
Think about what that means for companies dedicating significant square footage to large conference rooms.
It’s not that companies necessarily have too much meeting space. It's that they may not have the right mix of spaces for how people actually work.
More small meeting rooms? Private focus spaces? Fewer oversized conference rooms?
The answers start with understanding how existing space is being used.
Hear Enid break down the findings. 👇
Full H1 2026 Space Utilization Index: hubs.ly/Q04F9T9r0
Replay the webinar:
hubs.ly/Q04F9T9s0
56
92% of organizations measure space utilization with badge swipes.
A badge swipe tells you someone walked in. It can't tell you how many people were in the building at 2 p.m., which floors filled up, or which rooms sat empty while the calendar showed them booked. Plan a portfolio around door counts and you end up sizing space for attendance instead of use.
Melissa Michalik of @JLL raised this at our H1 2026 Space Utilization Index webinar. We wrote up why it happens and what it costs to guess: hubs.la/Q04F6jPL0
The full H1 2026 Space Utilization Index: hubs.la/Q04F6jPM0
#CorporateRealEstate #WorkplaceStrategy

1
8
Want the numbers behind it? The full H1 2026 Space Utilization Index: hubs.la/Q04F3n5Y0
2
Day three at the Higher Ed Facilities Forum in San Antonio, and our Matt Boyd is still smiling. #HEFF
It's been a good few days. Time with clients and @SCUP study partners we usually only see on video calls, plenty of new faces, and a main stage panel worth passing along.
Carrie West of @UTAustin, Kristine Kenney of @UW, Ken of @michiganstateu and John D'Angelo of @IUBloomington talked about lining up campus facilities work with the university's bigger strategic goals. Occupancy came up as one of the things they're working toward, and it was good to hear it named from the stage.
One thing Matt heard in his one-on-ones: data that shows up a day late can't help you run a building today. Real-time occupancy is what lets HVAC and custodial follow the people instead of the schedule.
Thanks to everyone who made time to talk, and to the HEFF team for pulling it all together. If we didn't get to meet, Matt's calendar is in the replies.
#HigherEd #FacilitiesManagement #CampusPlanning #SpaceUtilization #OccupancyAnalytics


1
16
Students vote with their feet.
Across 100+ campuses, recreation is the most heavily used space type we measure. 63 to 65% Monday through Wednesday, and still 42% on a Sunday.
Study space trails it every day. 14 to 17 points behind midweek, and more than 20 points behind on Friday and Saturday.
But occupancy isn’t the whole story. Students stay longer in study space than they do in recreation. They drop into rec more often and settle in to study. These are two spaces doing different jobs, which is why it’s worth measuring both.
Know which of your spaces is working before you make your next building move.
We’re at Higher Ed Facilities Forum (HEFF) this week. If you’re attending, reach out to Matt Boyd to discuss your space needs.
Data from the Spring 2026 Higher Ed Space Utilization Index. Full report: hubs.la/Q04DP2NM0

8
Badge data tells you who walked in. It doesn’t tell you how many people were actually there.
At our H1 2026 Space Utilization Index webinar, Melissa Michalik LEED AP,CFM, JLL’s Global Occupancy Planning & Management Leader, explained how planning around badge swipes can turn into a seven-figure mistake.
The gap is bigger than most teams expect. In one building we measured, 701 people badged in on the busiest day of the week. The most ever inside at once was 439. Size the space to badge counts and you’d plan for 60% more people than were ever there.
92% of organizations still use badge data to understand occupancy. Only 7% rate their occupancy data as excellent.
Hear Melissa’s take 👇
Full H1 2026 Space Utilization Index and webinar replay in the comments.
1
1
40
Watch the full webinar replay with Melissa Michalik of JLL: hubs.la/Q04CGCcZ0
Get the H1 2026 Space Utilization Index, with measured occupancy from 50M+ sq ft: hubs.la/Q04CGCgw0
#SpaceUtilization #CorporateRealEstate #WorkplaceStrategy #OccupancyPlanning
15
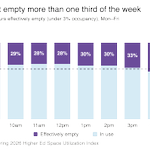
Prime teaching hours. Empty classrooms.
On a typical Wednesday at 11 a.m., 26% of classroom hours show less than 3% occupancy. Effectively empty, at the busiest point of the week.
Zoom out and the pattern holds. Between 8 a.m. and 5 p.m., Monday through Friday, classrooms sit effectively empty more than a third of the time. The fullest hour of the week is still 28% empty.
Those rooms are still being heated, cooled and ventilated like they’re full.
That’s where measurement pays off fastest. When occupancy data feeds HVAC and demand-control ventilation, systems scale back in empty rooms and ramp up when people arrive. In our analysis, most universities would see a 3–5x return on measurement from that integration alone.
Do you know which of your classrooms are empty right now?
Data from the Spring 2026 Higher Ed Space Utilization Index. Link in comments.
We’ll be at Higher Ed Facilities Forum (HEFF) next week. If you’d like to discuss what this looks like on your campus, reach out to our own Matt Boyd.

1
21

We measured 50 million square feet of office space. Here’s what we found.
The H1 2026 Space Utilization Index is out: sensor-measured occupancy across corporate office portfolios, February through June.
📉 RTO policies aren’t having the desired effect.
People are coming in, but not at the rates many plans assume. Weekly peak utilization has plateaued at 52.3% — at the busiest moment of the week, the average office is just over half full.
📅 The office week has a three-day core.
Mondays now look more like Fridays, with average daily peaks of 23% and 19% respectively. Tuesday is the busiest day at 42%, making it the critical day for space planning and operations.
🪑 Space isn’t always used as intended. Conference rooms sit empty 3.75 hours a day on average. When they are in use, 78% of that time holds two people or fewer, including rooms built for 7 or more. They’re doubling as private offices, while open collaboration areas remain underused.
👥 People come in for people.
Nobody drives 30 minutes to take a Zoom call they could take more comfortably at home. Dining and gathering spaces reach 56% average daily peak utilization, compared with 35% for open workspaces and 21% for the open collaboration areas companies keep adding.
Today's offices are operating differently than what they were designed for. Yet many are still being planned, staffed and operated as though the old patterns apply.
Missed it live? Watch the full conversation with Melissa Michalik of JLL here: hubs.la/Q04CHVZh0
Get the H1 2026 Space Utilization Index behind the discussion, with measured occupancy from 50M+ sq ft: hubs.la/Q04CHVYJ0
#SpaceUtilization #OccupancyIntelligence #CorporateRealEstate #WorkplaceStrategy #Occuspace


18
We’re in Chicago this week for @CoreNet Global's Summit, and the same issues keep coming up: RTO policy, site consolidation, office allocations, share ratios, renovation plans, and where AI actually fits into any of it.
Every one of those decisions rests on a single question. How is the space actually being used?
Most teams answer it with badge swipes and room bookings. A swipe proves someone entered the building. A booking proves someone reserved a room. Neither proves the space got used, when, or for how long.
@MelissaMichalik LEED AP,CFM, Global OPM Operations Leader at @JLL, put it plainly on our recent webinar:
“Badge data doesn’t track when people leave the space. It tracks when people come in. So if you’re using badge data solely to understand your utilization, you stand to make some big errors.”
She and @EnidMaran, our Head of Customer Success, got into what that gap costs you when you’re planning a portfolio. Clip below.
If you’re here, come find us at Booth 123. Bring a floor plan and a question about it.
1
1
27
This year's CoreNet Global Summit theme is "From Complexity to Clarity." For most CRE leaders, that's a pretty good description of the job.
Hybrid schedules, consolidation decisions, budgets that want proof before anything moves. The complexity is constant. Clarity usually starts with one plain question:
How is your space actually being used?
Nic, Linus and Alex are at Booth 123 in Chicago, October 26–28. If there's a portfolio call you're making on gut feel right now, stop by or send a note to set up time.
Stop Guessing. Start Knowing.
#CNGSummit #CNG26Chicago

1
11