

Data-driven research tool that organizes and interprets historical price movements. Omnis Analytics Dashboard v1.0 10/03/2025
Joined March 2025
- Tweets11
- Following7
- Followers72
- Likes10


@CostaMooney @iLLu77
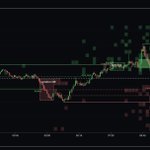
So we added a new visualisation to Omnis. A Time × Magnitude heatmap showing:
When the daily high or low tends to form
How far it usually extends by that time...Live, in real time !
Not theory.
Historical distribution.

Watch our NQ indicator plot in real-time throughout the session.
Session zones. Scenario levels. All updating live as price develops.
15+ years of data behind every line on the chart.
#NQ #FuturesTrading
want to learn more?
Join our Discord and join a walkthrough/live session.
omnis-analytics.com
1
165
Know your levels before price gets there.
Daily page overview 👇
#NQ #FuturesTrading
So many data points... That have an intertwined relationships its important to display / visualise relevant data for the process at that time and stage of study. What Probabilities right?
We removed unnecessary Asia/London datapoints and included EEZs.

We're super excited to announce that version 1 of the Omnis Analytics Dashboard is out! Check out our Whop here: whop.com/omnis-analytics/ and our discord here: discord.gg/BqCwQzAZbM
1
2
370
🚀 Omnis dB is here 🚀The most powerful Trading Database is here.
- Time-based insights that matter - Multi asset session probabilities refined over 12+ yrs - Precision driven analytics
- Strategy refinement
No guessing. Start trading with confidence. 🔗 discord.gg/zwTUKPS6

2
303