

Created by professional traders who wanted a better path for serious traders. Fair rules, live trade plans, fast payouts, and support built for growth.
Joined April 2025
- Tweets1.2K
- Following164
- Followers197
- Likes469




Five of the Magnificent 7 have reported. Estimated market cap changes from each earnings-day close through Oct 29: 💥
Alphabet (Oct 28): -19.78%, about -$504.7B
Meta (Oct 21): -11.09%, about -$186.9B. Strong results, but heavy spending caused anxiety.
Amazon (Oct 29): -7.96%, about -$178.9B. Net income topped $20B, but free cash flow plunged (a $42.4B outflow over the trailing 12 months).
Microsoft (Oct 28): -2.45%
Tesla (Oct 21): +7.48%, about +$66.5B
The graphic’s combined estimated net market cap loss is $810.5B.
These are estimates. Amazon uses an Oct 29 after-hours price of about $227.21 vs a $243.79 close, so it’s indicative, not final. The other names use Oct 29 closes. Share counts are held roughly constant, and the comparison windows differ.
#Mag7 #Earnings #Alphabet #Meta #Amazon #Microsoft #Tesla #Stocks #PitBullTraders #MrTopStep

Market cap change, Oct 13 to Oct 29, 2026, for five of the Magnificent 7: 📉
Alphabet: -19.78% (-$859.8B), from $4.35T to $3.49T
Meta: -16.51% (-$353.2B)
Amazon: -5.72% (-$159.6B)
Microsoft: -2.45% (-$98.9B)
Tesla: +7.48% (+$110.9B)
The combined net market cap loss across those five is $1.36 trillion, and only Tesla is higher. How many of the Magnificent 7 are still leading this market?
#Mag7 #MarketCap #Alphabet #Meta #Amazon #Microsoft #Tesla #PitBullTraders #MrTopStep

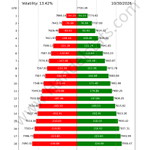
How far can the SPX travel? Here’s the implied move, day by day 🎯
1 day: ±54.23 (7,666.16 to 7,774.62)
5 days: ±121.26 (7,599.13 to 7,841.65)
9 days: ±162.69 (7,557.70 to 7,883.08)
All of it is based on 13.42% implied volatility from Thursday’s 7,720.39 close. Useful for sizing strikes and setting realistic expectations.
Credit: @HandelStats
#MrTopStep #PitbullTraders #SPX #Options #Volatility #Trading

After the bell, ES moved 43 points in just 15 minutes 👀
That’s more than the entire cash session range, and the biggest post-close 15-minute move in the last 30 days.
The chart breaks down opening range, first hour, last hour and post-close ranges for ES, NQ, RTY and YM, against their 5, 10 and 30-day averages. It shows what a normal day looks like and when today is anything but.
Credit: @HandelStats
#MrTopStep #PitbullTraders #ES #Futures #MarketStats #DayTrading #Trading

Where can price go today? Here are the 1 SD ranges from implied volatility 📈
ES: 7,664.16 to 7,765.84 (IV 12.59%)
NQ: 28,861.10 to 29,501.40 (IV 20.96%)
RTY: 2,844.69 to 2,896.11 (IV 17.11%)
YM: 52,125.20 to 52,858.80 (IV 13.35%)
The +2 SD and -2 SD levels are on the chart too. Moves outside the 1 SD range are the exception, not the rule.
Credit: @HandelStats
#MrTopStep #PitbullTraders #ES #NQ #RTY #YM #Volatility #Futures #Trading

Friday’s pivots are in 📊
ES: Pivot 7,731.50 | R1 7,750.75 | S1 7,695.75
NQ: Pivot 29,323.08 | R1 29,535.17 | S1 28,969.17
After the bell, ES settled at 7,715.00 and NQ at 29,181.25. Both are trading below their pivots.
Big picture: SPX is 1.6% below its 52-week high of 7,844.52. NDX is 6.25% below its high of 31,361.37.
Know your levels before the open.
Credit: @HandelStats
#MrTopStep #PitbullTraders #ES #NQ #SPX #Futures #DayTrading #Trading


97 years since Black Tuesday (Oct 29, 1929), on record volume of ~16.4M shares. Biggest one-day Dow drops: 1) Black Monday 1987 -22.61%, 2) COVID crash 2020 -12.93%, 3) Oct 28, 1929 -12.82%, 4) Black Tuesday -11.73%. #MarketHistory

$ESZ26 Wednesday: +26.25 (+0.34%) to 7,784.50. Range 7,751.50-7,794.25. Settled 7,783.25, above VAH 7,779.00. tPOC 7,771.00 / VAL 7,761.00. Bull: hold settlement, then 7,794.25 and 7,803.00. Bear: lose VAH, then tPOC and VAL 7,761.00. #ES #MarketProfile

Tom Incorvia: Market Profile xitter.gq/i/broadcasts/1dxYlaZLR…
Trade the range.
$NQ daily: last close 29,855.75 (+0.15%), sitting right under the 30,000 area.
Range since the spring rally: support near 29,200, resistance near 30,000 to 30,100. Heavy volume sits in this zone, so expect chop until one side breaks.
Plan your levels. Manage your risk.
@MrTopStep | @PitBullTraders
Not financial advice. Futures trading involves risk of loss.

LIVE From the Pit | Dani: Markets & Mindset xitter.gq/i/broadcasts/1AxRnZQlO…
Live Futures Trading with David Dube Oct. 28 xitter.gq/i/broadcasts/1pKdRDqal…
Approximate 2026 capital expenditure guidance and estimates: 🏗️
Amazon (AWS): $220B
Alphabet (Google Cloud): $200B
Microsoft (Azure): $175B
Meta (Facebook, Instagram and AI infrastructure): $137.5B
Oracle (OCI): $70B
That’s an estimated $802.5B in total for 2026. Goldman Sachs projects about $1.2T in 2027 for leading AI hyperscalers.
Wall Street’s growing concern: according to Reuters, these five companies could collectively spend more on capital expenditures than they generate in free cash flow by 2027, raising questions about the financial sustainability of the AI infrastructure boom.
Figures are approximate and compiled from company guidance and analyst estimates. Microsoft and Oracle may be on fiscal-year guidance, and not all spending is exclusively AI-related. Sources: Forbes, Goldman Sachs, JPMorgan, Reuters.
#AI #BigTech #Capex #Amazon #Alphabet #Microsoft #Meta #Oracle #PitBullTraders #MrTopStep

December ES, July 27 to October 27, 2026: 🛁
Three-month high: 7,905.00 (Aug 13)
Three-month low: 7,386.00 (Jul 29)
High-to-low range: 519.00 points (7.03% of the low)
Tuesday’s close: 7,758.25, which is 146.75 points (-1.86%) below the high and 372.25 points (+5.04%) above the low
That puts ES about 72% of the way up its three-month range. The water keeps sloshing between the same walls: a 519-point range, and we finished about 147 points below the August high.
Barchart’s three-month high/low summary confirms the 7,905.00 high and 7,386.00 low.
#ES #ESZ26 #SPX #Futures #Levels #DayTrading #PitBullTraders #MrTopStep
