

BlockPhi access: https://xitter.gq/t.co/YbTtxSCFGC Documenting the journey - Quantitative Investing - Macroeconomic Modelling - Long & Medium-term focused
In The Markets
Joined November 2022
- Tweets1.3K
- Following149
- Followers276
- Likes1.1K




QuantSy retweeted

Global liquidity added $1.4 trillion last week.
Supported by: firmer central bank liquidity (+US$246bn) and a deeper collateral pool (+US$369bn)
Though momentum still sits in the bottom third of its history.


QuantSy retweeted
Two independent regime signals now aligned:
→BTC/USD vs Inverted DXY from @JackGreenCrypto : risk-off regime flagged from around May 18th to June 28th, 2026 before expecting some bullish pressure in the markets according to the 90 day lag posted.
→ Macro Quarterly RoC Dashboard: Global Liquidity RoC expected to turn negative after peaking on May 18th, 2026, then flipps to a risk-off regime on June 10th according to a similar 90 day lag.
What this means is that we can expect some down pressure in second half of May before the risk-off threshold is breached.
Negative RoC was the early tell. The threshold breach was the confirmation. Both clocks now pointing the same direction.


QuantSy retweeted
Most people are staring at the price action and seeing a breakdown.
Look again. Price is bleeding, but momentum already bottomed and is turning up.
That’s not what a true collapse looks like. That’s what a reset looks like. The market doesn’t move in straight lines — it expands, exhausts, resets… then expands again.
If you only react to price, you’ll exit at the exact moment structure is rebuilding. Positioning here matters.
Meanwhile, Mercury Pulse has been keeping a risk-off signal this entire mini-recovery acting like a shield against noise.
$BTC 📈

QuantSy retweeted
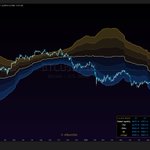
$BTC is bleeding. Risk is not. Here's the Risk Suite Update for the day (Available in the link in bio):
The QuantSy Risk Heatmap is sitting at 1.29 — Elevated Risk territory, but falling.
PARALLAX tells the more interesting story: Risk Score 3.8/100. LOW zone. Despite the drawdown, price is approaching fair value on a band-distance basis.
Freefall Protocol confirms the setup: −44.5% from ATH. Deep enough to hurt. Deep enough to matter.
Markets bleed. Edge comes from knowing when the risk structure disagrees with the price action.

QuantSy retweeted
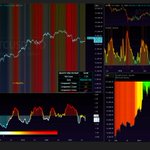
$BTC has repriced to $70K. The Universal Valuation composite is reading −1.32.
This level has only appeared in significant DCA zones — 2019, 2020, the 2022 lows. Each instance marked a structural accumulation window, not a temporary bounce setup. The right panel shows how aggressively valuation collapsed from cycle highs into this range.
This isn't noise. It's one of the deepest sustained readings this indicator has ever produced.
The market feels broken. The data disagrees.
The public version is available — and it just got cheaper. Link in bio.
