

Through objective analysis, we study what issues affect farm and rural finances and how policy decisions influence outcomes in U.S. farm and rural communities.
- Tweets307
- Following192
- Followers303
- Likes360



ALT Graphic from the University of Missouri Rural & Farm Finance Policy Analysis Center announcing the release of the “Fall 2026 Farm Income Outlook for Illinois.” The graphic features a yellow banner reading “Available now” and a waterfall chart titled “Illinois net farm income to increase 44% in 2026.” The chart shows net farm income rising from $4.17 billion in 2025 to $6.01 billion in 2026. Positive contributors include crop receipts (+$1.13 billion), crop insurance indemnities (+$0.15 billion), and government payments (+$1.18 billion). Negative contributors include livestock receipts (-$0.46 billion), production expenses (-$0.07 billion), and all other changes (-$0.08 billion).

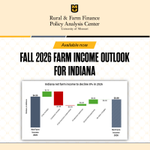
ALT Graphic from the University of Missouri Rural & Farm Finance Policy Analysis Center announcing the release of the “Fall 2026 Farm Income Outlook for Indiana.” The graphic includes a yellow banner reading “Available now” and a waterfall chart titled “Indiana net farm income to decline 8% in 2026.” The chart shows net farm income decreasing from $4.35 billion in 2025 to $3.98 billion in 2026. Positive contributions include crop receipts (+$0.76 billion), lower production expenses (+$0.26 billion), and government payments (+$0.65 billion). Negative contributions include livestock receipts (-$1.98 billion) and crop insurance indemnities (-$0.05 billion). All other changes have no net effect.

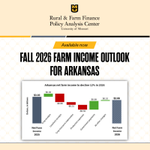
ALT Graphic promoting the University of Missouri Rural & Farm Finance Policy Analysis Center’s “Fall 2026 Farm Income Outlook for Arkansas.” The design features the University of Missouri logo and a yellow banner reading “Available now.” A waterfall chart shows Arkansas net farm income declining 12% in 2026, from $3.03 billion in 2025 to $2.66 billion in 2026. Positive contributions include crop receipts (+$0.36 billion), government payments (+$0.99 billion), and all other changes (+$0.10 billion), while livestock receipts (-$0.96 billion), crop insurance indemnities (-$0.31 billion), and production expenses (-$0.55 billion) reduce income.

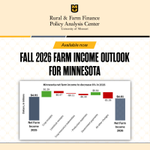
ALT Promotional graphic from the University of Missouri Rural & Farm Finance Policy Analysis Center announcing the release of the Fall 2026 Farm Income Outlook for Minnesota. A waterfall chart shows Minnesota net farm income declining from $4.91 billion in 2025 to $4.61 billion in 2026, a decrease of about 6%. Positive contributions include crop receipts (+$1.29 billion) and government payments (+$0.64 billion), while declines in livestock receipts (-$0.47 billion), crop insurance indemnities (-$0.11 billion), production expenses (-$0.30 billion), and all other changes (-$1.35 billion) reduce overall income. The graphic features University of Missouri branding and an “Available now” banner above the title.

ALT Promotional graphic from the University of Missouri’s Rural & Farm Finance Policy Analysis Center announcing the availability of the “Fall 2026 Farm Income Outlook for North Dakota.” The graphic features University of Missouri branding at the top and a highlighted banner reading “Available now.” A waterfall chart shows North Dakota net farm income rising from $2.98 billion in 2025 to $3.86 billion in 2026, an increase of about 30%. Positive contributors include crop receipts (+$0.36 billion), livestock receipts (+$0.08 billion), crop insurance indemnities (+$0.26 billion), and government payments (+$1.02 billion). Negative contributors include production expenses (-$0.35 billion) and all other changes (-$0.48 billion). The design uses black and gold accents on a light patterned background.

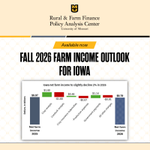
ALT Promotional graphic from the University of Missouri Rural & Farm Finance Policy Analysis Center announcing the release of the Fall 2026 Farm Income Outlook for Iowa. The graphic features the University of Missouri logo, an “Available now” banner, and a waterfall chart titled “Iowa net farm income to slightly decline 2% in 2026.” The chart shows net farm income projected to decrease from $9.97 billion in 2025 to $9.78 billion in 2026. Positive contributors include crop receipts (+$1.80 billion), crop insurance indemnities (+$0.46 billion), and government payments (+$1.14 billion). Negative contributors include livestock receipts (-$1.80 billion), production expenses (-$0.87 billion), and all other changes (-$0.91 billion). The chart illustrates that gains in crop receipts and government payments are nearly offset by declines in livestock receipts, higher production expenses, and other factors, resulting in a modest decrease in Iowa net farm income in 2026

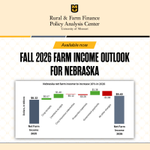
ALT Promotional graphic from the University of Missouri Rural & Farm Finance Policy Analysis Center announcing the release of the Fall 2026 Farm Income Outlook for Nebraska. The graphic features the University of Missouri logo, an “Available now” banner, and a waterfall chart titled “Nebraska net farm income to increase 16% in 2026.” The chart shows net farm income projected to rise from $8.12 billion in 2025 to $9.40 billion in 2026. Positive contributors include crop receipts (+$0.57 billion), livestock receipts (+$1.40 billion), and government payments (+$1.38 billion). Negative contributors include crop insurance indemnities (-$0.12 billion), production expenses (-$0.28 billion), and all other changes (-$1.68 billion). The chart highlights that gains from agricultural receipts and government payments are expected to more than offset declines and higher costs, resulting in stronger farm income for Nebraska in 2026.

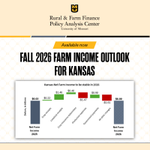
ALT Promotional graphic from the Rural & Farm Finance Policy Analysis Center announcing the release of the Fall 2026 Farm Income Outlook for Kansas. The graphic features the University of Missouri logo, an “Available now” banner, and a waterfall chart titled “Kansas Net Farm Income to be stable in 2026.” The chart shows net farm income remaining essentially unchanged, declining slightly from $6.03 billion in 2025 to $6.00 billion in 2026. Positive contributors include crop receipts (+$0.22 billion), livestock receipts (+$1.46 billion), crop insurance indemnities (+$0.46 billion), and government payments (+$0.90 billion). Negative contributors include production expenses (-$1.47 billion) and other changes (-$1.61 billion). The overall message is that gains in receipts, indemnities, and government payments are expected to offset higher expenses and other negative factors, resulting in stable farm income for Kansas in 2026.

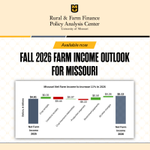
ALT Promotional graphic from the University of Missouri Rural & Farm Finance Policy Analysis Center announcing the release of the “Fall 2026 Farm Income Outlook for Missouri.” The graphic features the University of Missouri logo and the text “Available now.” A waterfall chart shows Missouri net farm income projected to increase 11% from $4.61 billion in 2025 to $5.13 billion in 2026. Positive contributors include crop receipts (+$0.35 billion), crop insurance indemnities (+$0.07 billion), government payments (+$0.50 billion), and other changes (+$0.26 billion). Negative contributors include livestock receipts (-$0.44 billion) and production expenses (-$0.22 billion). The chart headline reads, “Missouri Net Farm Income to increase 11% in 2026.”

ALT Promotional graphic announcing a new report from the Rural & Farm Finance Policy Analysis Center at the University of Missouri. The design features the RaFF Early Warning System (EWS) logo at the top right, a black banner reading “NEW REPORT AVAILABLE!” at the top left, and a gold outline icon of three people with speech bubbles in the center. Large text reads: “RAFF’S EARLY WARNING SYSTEM (EWS) CONSENSUS REPORT: ARKANSAS.” The University of Missouri Rural & Farm Finance Policy Analysis Center logo appears at the bottom left on a beige and light gray background with gold, blue, and black accent lines.

ALT Promotional graphic announcing a new policy brief from the Rural & Farm Finance Policy Analysis Center (RaFF). Large headline reads, “Modeled 45Z Emissions Factors for Corn and Sorghum Ethanol.” The center of the image features a county-level U.S. map shaded by emissions factor values for a corn ethanol scenario using no-till and cover crop practices. A legend shows emissions factors ranging from 0.1 to 0.8. Below the map, text states: “The brief includes county-level estimates under various conservation practices.” The University of Missouri and RaFF logos appear at the bottom. The design uses a light tan and gray color scheme with black title text.

ALT Promotional graphic for the University of Missouri Rural & Farm Finance Policy Analysis Center. Across the top are photos of a black cattle, an ear of corn, a bank building, soybean pods, and a piglet. Text reads, “Coming soon! Fall 2026 Farm Income Outlooks” with participating states listed: Missouri, Arkansas, Illinois, Indiana, Iowa, Kansas, Minnesota, Nebraska, North Dakota, and Texas. A banner at the bottom says, “Subscribe for email updates.” The background features a subtle geometric pattern in gold and white.

ALT Promotional graphic for RaFF’s Early Warning System of Farm Financial Stress. A banner reading “NOW AVAILABLE!” appears above the headline “RaFF’S LEADING INDICATORS – Fall 2026 Update.” The center of the image shows a dashboard screenshot titled “Leading Indicators of Farm Financial Stress Data Visualizer, Updated Fall 2026,” with risk gauges and momentum indicators for categories including farmer and banker sentiment, farm income and balance sheet health, farm machinery market dynamics, and credit quality. The Rural & Farm Finance Policy Analysis Center and University of Missouri logos appear on the dashboard and at the bottom of the graphic. The design uses black, gold, gray, and cream colors.

ALT Graphic promoting a new RaFF policy brief titled “Higher Income, Lower Liquidity: Financial Stress Signals Among Iowa Farms in 2025.” The graphic includes a stacked bar chart showing the distribution of Iowa farms by liquidity rating from December 2016 to December 2025. Over time, the share of farms rated financially vulnerable (red) declines from about 22% to 19%, while the share rated strong (green) generally increases, reaching around 41% in 2023 and remaining above 34% in 2025. At the same time, the proportion of farms with no current liabilities (gray) remains relatively stable at roughly 36% to 45%. The chart illustrates that despite higher farm incomes, liquidity challenges persist for many farms. The graphic is branded with the Rural & Farm Finance Policy Analysis Center at the University of Missouri.

ALT Promotional graphic for the Rural & Farm Finance Policy Analysis Center at the University of Missouri announcing “RaFF’s All-New 2026 ARC/PLC Payments Explorer.” The image features a large headline above a screenshot of the online tool, which allows users to select a county, crop, and irrigation system and view projected 2026 ARC and PLC farm program payments. The dashboard example displays data for Boone County, Iowa, corn, non-irrigated acres, with payment scenarios, charts, and gauges comparing projected yields and payments. RaFF and University of Missouri branding appears at the bottom of the graphic.

ALT Graphic promoting a Rural & Farm Finance Policy Analysis Center policy brief titled “Extra ARC-CO and PLC Payments from the One Big Beautiful Bill Act.” The graphic explains that a large share of projected payment increases in crop year 2025 comes from a temporary provision allowing producers to receive the higher of ARC-CO or PLC payments regardless of their program election. A stacked bar chart shows sources of payment increases for corn, soybeans, and wheat. For corn, increases are 15% from ARC change, 11% from PLC change, and 74% from the special rule. For soybeans, increases are 3% from ARC change, 5% from PLC change, and 92% from the special rule. For wheat, increases are 16% from ARC change, 47% from PLC change, and 37% from the special rule. The University of Missouri Rural & Farm Finance Policy Analysis Center logo appears at the bottom.

ALT Graphic from a Rural & Farm Finance Policy Analysis Center policy brief titled “Extra ARC-CO and PLC Payments from the One Big Beautiful Bill Act.” The graphic explains that projected 2026 payments are evaluated under three enrollment scenarios and compares national projected ARC-CO and PLC payments under the FB18 baseline and OBBBA, along with the additional payments generated by OBBBA.


ALT Promotional graphic for a RaFF policy brief. Large black text on a light gray background reads, “Lender Costs, Market Structure and Farm Loan Rates.” Smaller italic text below states, “How changes in cost of funds affect ag loan interest rates.” A black banner in the upper left corner says, “A new policy brief from RaFF.” The Rural and Farm Finance Policy Analysis Center and University of Missouri logos appear in the lower left corner, with gold, gray, and black accent bars along the bottom edge.

ALT Promotional graphic for a RaFF policy brief titled “U.S. Chapter 12 Farm Bankruptcy Filings: First Semester of 2026.” The graphic features a bar and line chart showing monthly U.S. Chapter 12 farm bankruptcy filings from January to June 2026. Monthly filings are 23 in January, 29 in February, 34 in March, 60 in April, 30 in May, and 25 in June, for a cumulative total of 201 filings by midyear. The Rural & Farm Finance Policy Analysis Center and University of Missouri logos appear at the bottom.