

Australia's independent property platform. Uncover what properties really sell for, track market trends and make smarter property decisions. Join free ↓
Australia
Joined August 2022
- Tweets10.2K
- Following257
- Followers13.1K
- Likes16.1K






🚨 Australian property market — Months of supply remaining
At the current rate of sales, how long would it take to clear existing property listings if no new properties entered the market?
📊 Ranked from highest to lowest supply:
#1 Gold Coast — 32 months
#2 Sunshine Coast — 26 months
#3 Sydney — 24 months
#4 Brisbane — 24 months
#5 Perth — 17 months
#6 Cairns — 15 months
#7 Central Coast — 14 months
#8 Geelong — 14 months
#9 Canberra — 13 months
#10 Melbourne — 12 months
#11 Hobart — 11 months
#12 Darwin — 10 months
#13 Wollongong — 10 months
#14 Adelaide — 10 months
#15 Townsville — 10 months
#16 Newcastle — 10 months
📈 Every single market recorded more new listings than tracked sales over the past three months.
The Gold Coast has almost three years of supply at its current sales rate, while Sydney, Brisbane and the Sunshine Coast have around two years.
More supply. More competition between sellers. Greater negotiating power for buyers.
Source: Spachus | 14 August – 14 November 2026.
#AusProperty #HousingMarket #RealEstate #Spachus
🏡 House Only Prices — Listing vs Sold
Over the past 3 months, median house sale prices were below original median asking prices in 14 of 16 markets.
The difference:
🔴 Sydney: -$79,000
🔴 Sunshine Coast: -$73,500
🔴 Central Coast: -$69,000
🔴 Gold Coast: -$65,000
🔴 Wollongong: -$54,500
🔴 Newcastle: -$50,000
🔴 Geelong: -$45,250
🔴 Brisbane: -$40,000
🔴 Perth: -$40,000
🔴 Melbourne: -$35,000
🔴 Darwin: -$30,000
🔴 Townsville: -$30,000
🔴 Adelaide: -$24,000
🔴 Cairns: -$20,000
Only two markets recorded higher median sold prices:
🟢 Hobart: +$12,500
🟢 Canberra: +$10,000
Source: Spachus | Houses only | Last 3 months
#AusProperty #HousingMarket #RealEstate #Spachus
🚨 $310,000 Below Last Sale Price:
🔴 Last sold June 2024: $2,110,000
🔴 Original listing price: $1,900,000
🔴 Now asking: $1,800,000
That's 14.7% below its last sale price just over two years ago. And it still hasn't sold.
#Spachus #AusProperty #SydneyProperty

📉 Gold Coast property market – November update
🔴 75.4% selling below asking price
🔴 $40,000 median discount
🔴 50.5% of priced listings reduced
🔴 48 days median time to sell
🔴 4,085 properties on the market
Prices are down 16.7% ($210,000) from their March 2026 peak. Spachus forecasts a further 10.6% decline over the next 12 months.
#GoldCoast #AusProperty #Spachus
📉 #Perth property market is slowing.
🔴 Time to sell: 56 days (Aug–Oct), up from 33 in May.
🔴 Active listings: 8,601 → 11,173 in just 60 days.
🔴 63% of 3,656 listings with valid price data have been reduced.
Slower sales. More choice. More negotiating power for buyers.

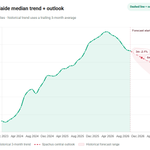
📉 Adelaide Property Market
The latest Spachus data points to further price declines in #Adelaide:
🏠 October 2026 median: $830,000
🔴 Down 6.2% from the April 2026 trend peak
🔴 3-month forecast: -2.1% → $813,000
🔴 6-month forecast: -4.1% → $796,000
📊 Based on 400 tracked sales in October, with the latest trend showing continued downward pressure. Adelaide's 3-year median price trend peaked at $887,000 in April 2026.
Source: Spachus | November 2026

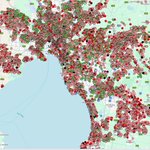
#Geelong is showing clear signs of price pressure over the last 6 months.
Across the map, dark red circles highlight properties selling 10%–20% below listing price, while black circles show homes selling more than 20% under.
That’s a strong sign many sellers are still having to meet the market — and in some areas, discount heavily to get a deal done.
#PropertyMarket #Victoria #RealEstate #HousingMarket #Spachus

🏠 Listing Price vs Sold Price — Australia
🔴 15 of 16 markets recorded median sold prices below median original listing prices over the last 3 months.
📊 Source: Spachus
🤖 Made with AI

Over the past 6 months, Spachus has tracked 14,066 property sales across #Melbourne.
📉 Here's what the data reveals:
🔴 85% sold below their listing price
🔴 $39,000 median discount below asking
🔴 $757,000 median price peak — Dec 2025
🔴 $727,000 latest median price
With 85% of properties selling below asking, Melbourne buyers appear to have significant room to negotiate.
📊 Independent property data from Spachus.

Some say property market prices are bottoming out. 📉
But when a property in Greystanes, #Sydney, is asking $1.6 million, it's hard to believe we've reached the bottom. There's still a long way to go before prices return to reality.
Buyers, hold the line. ✊
#SydneyProperty #PropertyMarket #Spachus


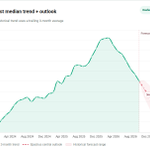
📢 Perth Property Market — How far could prices fall?
Perth's property market has fallen 9.6% from its March 2026 peak, according to the latest Spachus 3-month median price trend.
📉 The numbers:
🔴 March 2026 peak: $966,000
🔴 October 2026 trend: $873,333
🔴 Decline so far: $92,667 (-9.6%)
🔴 Next 6 months forecast: -7.8%, taking the median to approximately $802,000.
📊 How far could Perth fall?
In December 2023, Perth's median was around $580,000. That's a significant difference from where prices sit today.
Since the March 2026 peak, Perth's median trend has declined by approximately $13,200 per month.
💬 How far do you think Perth property prices could fall? Could we see 2023 prices again?
#Perth #PropertyMarket #Spachus #RealEstate

🏠 The desperation in the property market is becoming increasingly obvious.
The same voices who told us property prices would keep rising are now telling buyers to rush in because we've supposedly reached the bottom.
But are people still listening?
Australia doesn't need another property boom fuelled by hype and speculation. We need a sustainable housing market where future generations can actually afford a home.
The goal shouldn't be endlessly rising house prices. It should be a more affordable and sustainable future for Australia. 🇦🇺
#auspol #RBA

🏡 #GoldCoast Property Market – What a Difference a Year Makes! 👇
💰 November 2025: Sold for $895,000
🔻 Originally listed: $869,000
🔴 Now: All offers over $800,000 considered!
That's $95,000 (10.6%) below its previous sale price at the current $800k asking level, before buying and selling costs.
#Spachus #GoldCoastProperty #PropertyMarket #RealEstate

🏠 #Sydney House Prices – Where Are Buyers Getting the Biggest Discounts?
📉 Latest Spachus data shows that most Sydney houses are selling below their advertised asking price.
🔴 Houses selling below asking price:
$500k–$749k: 89%
$750k–$999k: 93%
$1m–$1.249m: 91%
$1.25m–$1.499m: 88%
$1.5m–$1.999m: 78%
$2m–$2.999m: 63%
$3m+: 64%
📊 What does this mean?
🔴 Buyers of houses under $1.5 million are seeing the highest proportion of sales below asking price.
🟢 More expensive houses are more likely to sell at or above their asking prices.
⏱️ Houses over $3 million take longer to sell, with a median of 53 days.
The bottom line: Sydney house buyers generally have more room to negotiate, particularly in the lower price brackets.
📅 6 months to November 2026 | 2,005 tracked private house sales.
Source: Spachus – Independent Australian Property Data
#Sydney #PropertyMarket #HousePrices #Spachus
A huge thank you to everyone who has supported Spachus and helped us reach this milestone!
13,000 genuine followers, all grown organically. No paid followers, no shortcuts — just people interested in understanding what's really happening in Australia's property market.
As a truly independent property platform, we're committed to providing transparent, data-driven insights, even when the numbers aren't what everyone wants to hear.
Your likes, comments, shares and subscriptions help keep Spachus growing and independent. We're only getting started! 🚀
Thank you for being part of the Spachus journey. ❤️