The Trend (@TheTrend30) header
The Trend (@TheTrend30) profile picture

Crypto Insights| Web3 & DeFi Alpha| The Trend is my friend| Continue with your efforts. YouTube ▶️: https://xitter.gq/t.co/CVg8FbNsy1

WEB-3
Joined September 2023
Photo by The Trend (@TheTrend30)Photo by The Trend (@TheTrend30)Photo by The Trend (@TheTrend30)Photo by The Trend (@TheTrend30)Photo by The Trend (@TheTrend30)Photo by The Trend (@TheTrend30)Photo by The Trend (@TheTrend30)Photo by The Trend (@TheTrend30)Photo by The Trend (@TheTrend30)Photo by The Trend (@TheTrend30)
I share data driven crypto market analysis covering #Bitcoin ( $BTC ), #Ethereum ( $ETH), and major altcoins, with a focus on market structure, liquidity, on-chain data, and risk-aware outlooks. Full educational breakdowns on YouTube: youtube.com/@cryptotrendupda…
2
931
FEAR IS TAKING OVER THE MARKET - $BTC $ETH $SOL
47
The market is getting absolutely brutal. 183,196 traders were liquidated in the past 24 hours, with total liquidations reaching a staggering $1.62 billion. $BTC dropped below $68,000. ETH fell below $1,900. SOL slipped to $78. Is this the Bottom? Or more bottoms are coming?
1
63
Bitcoin might be repeating its 2023 recovery pattern. Back in 2023, the 200-day moving average acted as strong support during $BTC recovery phase. Now, in 2026, we're seeing a similar setup develop, with the 200-day moving average once again playing an important role.
17
Can $BTC hold the 75k level? A daily break and close below the $75k level might take bitcoin to $68k-$65k level where the next support stands.
16
Bitcoin ( $BTC ) and the crypto is stagnant and boring to trade at the moment. Don't burn yourself with high leverage.
21
A breakout above the trendline could trigger a rally toward $1.50, with further upside toward $2 if momentum continues. However, losing $1.2732 could expose $XRP to further downside toward $1.25 and $1 level
21
$DOGE has been facing major pullbacks over the past few weeks, but the chart is starting to look solid and interesting.
39
Pay more attention to the chart not the crowd. $BTC The plan still remain the same. 94k-98k very soon
16
$BTC has a major liquidation cluster around the $84K level.
23
🇺🇸 U.S. PPI DATA DROPS TODAY AT 8:30 AM ET! Previous: 5.4% | Forecast: 5.3% Above 5.3%: Markets could face more selling pressure. Below 5.3%: A relief rally could follow. At 5.3%: Markets may react unpredictably. Yesterday CPI news has already sent $BTC into lower levels.
1
56
Bitcoin never moves straight up. In 2017, 2021, and 2025, $BTC experienced corrections of 20% or more before pushing toward new highs. Volatility is part of the journey. Don't panic over every dip. Focus on the bigger trend, manage your risk, and stay disciplined.
26
Rate hike coming??? $BTC is below $82k
11
🇺🇸 US CPI inflation comes in at 3.7%, exceeding expectations of 3.6%. Inflation has now reached its highest level in four months. $BTC
96
$BTC briefly lost the $82.4K support but quickly recovered. As long as this level holds, a move toward $90K–$98K remains possible. $82.4K is the key level to watch this week.
$77k - $75k is the next important level to watch on the $BTC chart if $82.4k fails to hold. $77K is currently the 50 week moving average while $75k is the next important level on the daily timeframe.
23
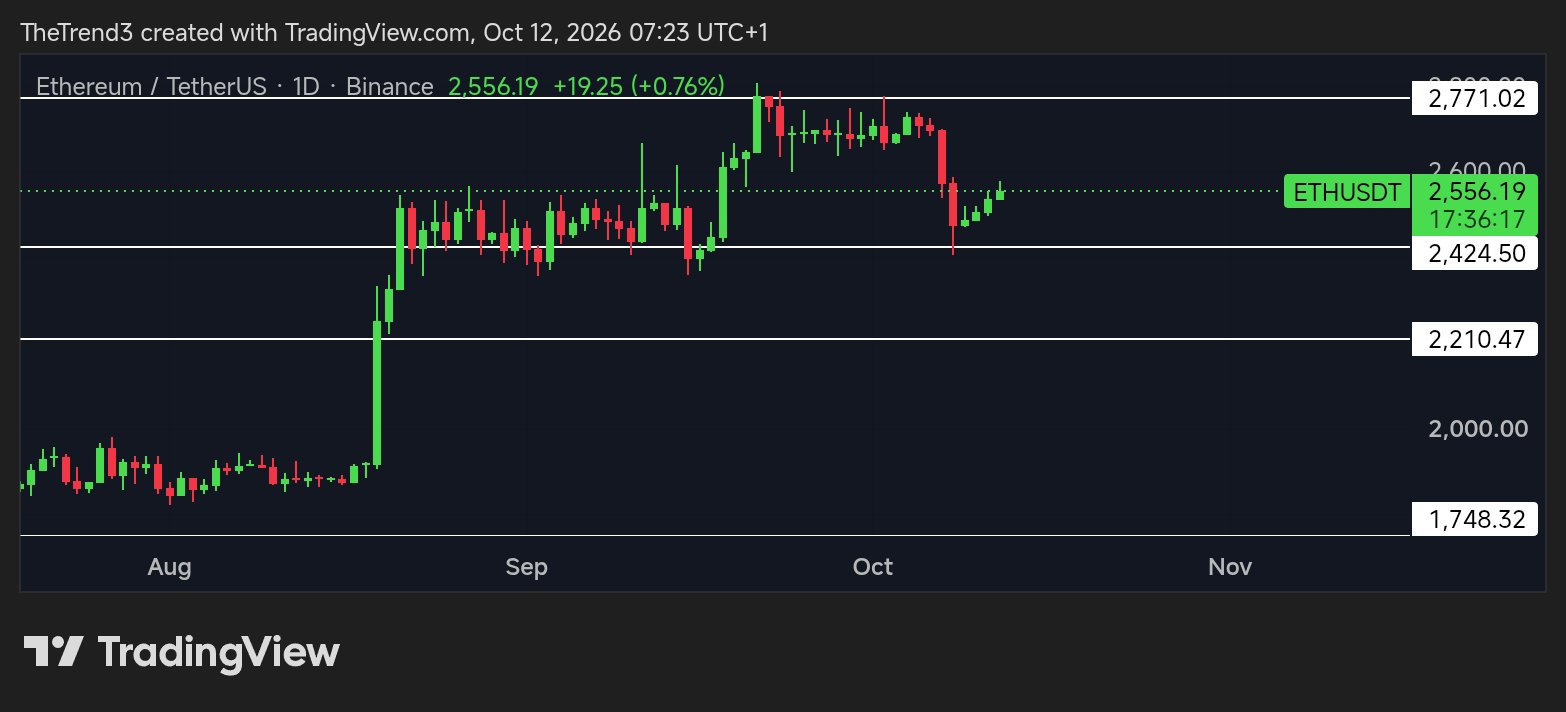
$ETH plan remains unchanged. The $2,424 support is holding strong, and my first spot order has been triggered. I'm watching $2,777 for a breakout confirmation and will accumulate more if price drops lower. Patience is key. Stick to the plan and let the market decide.
$ETH is getting heavily compressed on the 4H chart, with a breakout potentially coming soon. The key levels remain $2,777 and $2,424. I’ll wait for the triangle breakout and watch how price reacts at these levels before making a move. Patience. Let the chart confirm.
2
18
$77k - $75k is the next important level to watch on the $BTC chart if $82.4k fails to hold. $77K is currently the 50 week moving average while $75k is the next important level on the daily timeframe.
1
1
49
$BTC on the daily timeframe
18
$ETH is getting heavily compressed on the 4H chart, with a breakout potentially coming soon. The key levels remain $2,777 and $2,424. I’ll wait for the triangle breakout and watch how price reacts at these levels before making a move. Patience. Let the chart confirm.
1
1
93
$DOGE holding firmly above the $0.088 level is a bullish sign. I’m currently watching how price reacts if we get a retest of this level. If $0.088 continues to hold as support, it could strengthen the bullish structure.
38
$NEAR I will position myself on spot if the market gives me this level
66