

Crypto and macro, every morning.
- Tweets8K
- Following1.6K
- Followers5.7K
- Likes143K






ALT Bar chart: share of years the S&P 500 closed Dec 31 above its close on US election day (first Tuesday after the first Monday of November), 1970 to 2025. Midterm years: 64% (14 years). Other years: 74% (42 years). Dashed line: all years, 71%. Median gain: midterm +2.3%, other +3.2%. Source: Yahoo ^GSPC daily closes; 2018 and 2022 checked on FRED SP500.

ALT Dot strip: S&P 500 return one year after each midterm election day, 1950 to 2022. Years the president's party held both chambers (11): median +17.9%. Years it lost the House, Senate or both (8): median +9.2%, every one positive. A random day since 1950: +10.6%.


ALT Bar chart: share of separate episodes where big US-listed chip stocks, after falling 30%, 40% or 50%+ in a month, realized more than 62% annualized volatility over the next 23 sessions. Down 30%+: 64% (85 episodes). Down 40%+: 88% (33). Down 50%+: 83% (12). Dashed line: any month, 18%. 62% is the implied volatility on Intel's 4 Dec options. Source: Yahoo daily closes for 21 chip stocks 1990-2026; Robinhood INTC option chain 3 Nov.

ALT Histogram of McDonald's stock move from two sessions before each earnings report to two sessions after, 35 reports since 2018. Dashed lines at -4.0% ($255) and +3.5% ($275), the breakevens of the 6 Nov 265 straddle priced at $10.00 at the 2 Nov close. 29 of 35 moves fall between the lines, 6 outside. Source: Alpha Vantage MCD adjusted closes, earnings dates and option quotes.

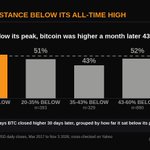
ALT Bar chart: share of days bitcoin closed higher 30 days later, grouped by how far it sat below its prior all-time high. 0-20% below: 57% (1,061 days). 20-35% below: 51% (393). 35-43% below: 43% (329). 43-60% below: 52% (890). Dashed line: any day, 55%. Today BTC is 38% below its peak. Source: Coinbase BTC-USD daily closes March 2017 to Nov 3 2026, cross-checked on Yahoo.


ALT S&P 500 paths for the 365 days after each of the 19 midterm election days since 1950, rebased to election day. Every path ends higher; only 3 dipped 10% below the election-day close. 2018 highlighted, ending +12%.


ALT Bar chart: share of Riot Platforms earnings reports where RIOT closed lower two sessions after the report than two sessions before. All reports since 2018 66% (n=35), since 2021 65% (n=23), since 2023 73% (n=15), after a 15%+ slide into the report 57% (n=7), against 52% for any 4-session stretch.

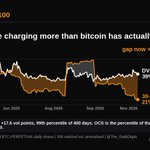
ALT Line chart, May to November 2026: Deribit DVOL implied volatility at 39 against bitcoin's 30-day realized volatility at 21, a gap of 17.6 vol points, the 99th percentile of the last 400 days. Source: Deribit DVOL and BTC-PERPETUAL daily closes.

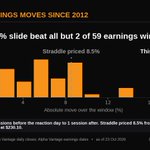
ALT Histogram of Lam Research's absolute stock move across 59 earnings reports since 2012, measured from the close 5 sessions before the reaction day to 1 session after. Most moves sit between 0% and 9%, median 5.6%. A grey dashed line marks the 8.5% the 23 Oct 2026 straddle priced; a white dashed line marks this report's 17.1% drop, exceeded by only 2 of the 59. Source: Yahoo and Alpha Vantage daily closes, Alpha Vantage earnings dates.


ALT Histogram of how far Lam Research stock moved around 59 earnings reports since 2012, from 5 sessions before the reaction day to 1 after. Most moves sit below 8%. A dashed line marks the 23 Oct straddle at 8.54%; 11 of 59 reports moved more.

ALT Bar chart: share of days when ether's realized volatility over the next 30 days topped 56.8%, the implied vol options charge today. When the prior month's realized vol was at or under 40%: 36% (209 days). At or under 38%: 30% (165 days). Dashed line: any day, 52%. ETH's last 30 days realized 36.3%. Source: Coinbase ETH-USD daily closes Sep 2022 to Nov 2 2026; implied vol from Block Scholes.

ALT Histogram of Qualcomm's absolute stock move over each earnings window since 2018, 35 reports, close 3 sessions before the reaction day to close 1 after. Median move 5.4%. Dashed line at 9.5%, the cost of the 6 Nov 162.5 straddle at the 2 Nov close; 11 of 35 reports moved more than that. Source: Alpha Vantage QCOM daily adjusted closes, earnings dates and option quotes.

ALT Bar chart: share of WTI crude 5%+ one-day drops after which the S&P 500 closed 5% or more below that day's close within 21 trading sessions. Every WTI -5% day since 2000: 52% (n=160). When the S&P rose the same day: 43% (n=67). 2020s only: 37% (n=60). Dashed line: any day since 2000, 27%. Source: Yahoo CL=F and ^GSPC daily closes, Sep 2000 to Nov 2 2026; cross-checked on FRED spot WTI, 51.4% vs 28.8%.


ALT Bar chart: share of times the Nasdaq 100 was higher 5 sessions after its first close 10% below an all-time high. All since 1985: 82% (n=34). Since 2001: 85% (n=13). One per 6 months: 80% (n=25). Dashed line: any week, 58%. Source: Yahoo ^NDX daily closes, Oct 1985 to 2 Nov 2026.


ALT Bar chart: share of bitcoin weekly candles that closed green after a streak of red weeks. After 3 red weeks: 50% (n=36). After 4 red weeks: 76% (n=17). Dashed line: any week since 2014, 54%. A fifth red week followed 4 of 17 times (2014 twice, 2022, Feb 2026). This week opened at $78,241. Source: Bitstamp BTC-USD daily, UTC weekly candles, Mar 2014 to 1 Nov 2026.


ALT Column chart: S&P 500 return one year after each US midterm election-day close, 1950 to 2022. All 19 positive, from 1.9% (1986) to 30.3% (1954); 2022 was 13.6%. Average 1950-98: 17.2%. Average 2002-22: 9.0%, against 10.0% for any one-year window since 2002. Source: Yahoo ^GSPC daily closes.

ALT Bar chart: worst bitcoin close in the 45 days after each US midterm election-day close. 2018 -49.9%, 2022 (FTX week) -14.9%, 2014 -5.8%. Any 45-day window since 2014 saw a 20% fall 21% of the time; 28% in 2026. Source: Yahoo Finance BTC-USD daily closes.