

Professional Trader & Investor | 30 Years in Global Markets | Founder, TradeOutLoud | Stocks • Futures | Risk First. Opportunity Always.
Florida, USA
Joined August 2009
- Tweets35.4K
- Following114
- Followers10.8K
- Likes21K

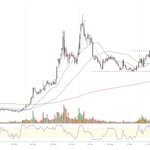
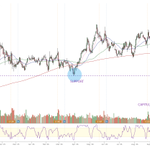
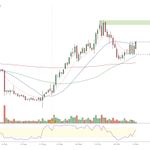
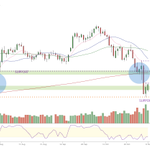


$CRL from last week ... Hope you got this too:


$CRL daily buy set-up post ER share.trendspider.com/chart/…

1
357
Post-earnings, $AMC is showing signs of strength. Higher highs and higher lows have been on track since the March bottom. share.trendspider.com/chart/…

After months of consolidating above $7.50 $BB might be getting ready to break above $9.75 and move towards resistance at 13.00 area.

$NVDA
Nvidia closed at $180.60 following a dramatic selloff from its recent highs near $240. The stock has broken below its 10 EMA, 21 SMA, 50 SMA, and 200 SMA, signaling significant technical deterioration. The latest decline was accompanied by exceptionally heavy selling volume, suggesting possible capitulation. While oversold conditions could produce a powerful relief rally, there is no confirmed bullish reversal yet.
🔴SUPPORT: $175-$170 | $163.52 (major historical support) | $160 | $150
🟢RESISTANCE: $190 | $200-$205 (200 SMA area) | $215 | $220
🐂BULLISH ABOVE $182.00: A sustained recovery above $1182.00 could trigger a short-covering rally toward $200-$205, followed by $215. Reclaiming the 200 SMA would be an important first step toward repairing the technical damage.
🐻EARISH BELOW $170 and $163: A confirmed breakdown could accelerate to $150.


🚨Major Economic Events This Week 👇
🟢Tuesday, November 10, 8:30 AM ET - Consumer Price Index (CPI)
This is one of the most important catalysts of the week. Cooler inflation could support growth stocks and improve market sentiment. Hotter inflation could put additional pressure on technology, Treasury yields, and expectations for Federal Reserve policy.
🟢Wednesday, November 11 - Veterans Day
The stock market remains open, but the bond market is closed. Trading participation may be lighter.
🟢Friday, November 13, 8:30 AM ET - Producer Price Index (PPI)
Another important inflation report. Investors will be especially sensitive to evidence that inflation remains persistent.
🚨These reports could determine whether the market finds stability or experiences another round of selling.
1
420


$META is attempting to stabilize near $615 following a sharp selloff from the $775 highs.
Price is testing a critical rising trendline and the $604.40 support level, while remaining below its major moving averages.
This is a potential technical reversal setup, but confirmation is still needed.
BULLISH ABOVE $633.29: A sustained breakout above this resistance could trigger a recovery toward $675-$685 (Target 1), followed by $770-$780 (Target 2)
BEARISH BELOW $604.40: A confirmed breakdown would violate the rising trendline and could accelerate selling toward $590, followed by $575-$550.
TRADING PLAN: I am watching for a daily reversal and a confirmed breakout above $633.29 before considering a new swing position. The current setup offers potential upside, but catching a falling stock without confirmation carries significant risk. Patience is essential, particularly with the broader technology sector under pressure.

$IQV nice action today and the weekly is actioanble next week share.trendspider.com/chart/…

