Gab (@TraderGab) header
Gab (@TraderGab) profile picture

Trading and playing with charts. Mostly Gold and Junior Explorers. Not investment advice, It is just a Twitter account...

Joined May 2014
Photo by Gab (@TraderGab)Photo by Gab (@TraderGab)Photo by Gab (@TraderGab)Photo by Gab (@TraderGab)Photo by Gab (@TraderGab)Photo by Gab (@TraderGab)Photo by Gab (@TraderGab)Photo by Gab (@TraderGab)Photo by Gab (@TraderGab)Photo by Gab (@TraderGab)
#gold Let's see IF the low is in ...
11
13
2
105
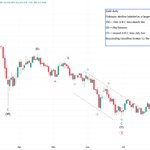
Clean breakout! 🚀After that grueling 9-month WXY correction, price is finally slicing through the downward channel. Last C-leg looks complete off the 3870 lows. Now it's all about reclaiming $4200 zone to confirm the 5 waves impulse. Let's see if bulls can sustain this momentum!
2
1
28
1,696
GOLD Possible last leg for #gold completed at 3870. Since September, structure looks like five waves that could confirm completion of the C-wave of the Double Three (WXY). Bulls need to break this downward channel 👀 xitter.gq/TraderGab/status/21162…
Gold's correction from January looks like a double zig-zag (WXY) with seven legs almost completed. In a potential reversal zone for a fourth wave. Must stay above 3706 (Fib.50%) with bullish divergence. Gold corrected ~30-34% in the 2008 GFC. #gold
2
27
2,310
Gold's correction from January looks like a double zig-zag (WXY) with seven legs almost completed. In a potential reversal zone for a fourth wave. Must stay above 3706 (Fib.50%) with bullish divergence. Gold corrected ~30-34% in the 2008 GFC. #gold
3
21
1
99
14,986
#Gold is breaking out of its descending channel after the possible completion of a WXY correction, signaling a bullish reversal. The recent $50 surge appears driven by Chinese buyers returning from Golden Week, while Western speculators remain notably absent.
1
1
11
781
TradingView finally shut down their chat rooms — completely overrun by trolls & trash talkers. About time, the content hit rock-bottom mediocrity. Good riddance!
457
Conventional wisdom says rate hikes kill gold. But history disagrees — #gold rallied during Fed tightening in the 1970s, the mid-2000s, and again from 2022–2026. Inflation, central bank buying, and geopolitical risk outweighed the rate headwind.
4
1
10
1,832
Gold Daily EW: Corrective WXY appears finished at the July C/(Y) low. Strong impulsive bounce + rising parallel channel = bottom is likely in. Bullish continuation preferred while the low holds. #Gold #ElliottWave
2
9
560
Gold daily February decline labeled as a larger-degree W-X-Y complex correction: (W) = first A-B-C into March low (X) = April bounce (Y) = second A-B-C into July low Descending trendline broken to the upside → correction likely complete. Bullish. #gold
1
1
8
495
Called the $3900 zone back in early June Looking at the actual low, spot #gold bottomed very close to $3940. High probability that was the low of this correction. Structure held, selling pressure exhausted, and price has already started reclaiming levels. xitter.gq/TraderGab/status/20647…
The current #gold correction mirrors the 2008 pattern but is unfolding faster, meaning a 30% drop could bring prices down to $3,900.
1
6
1,034
The largest drawdowns for #gold over periods of less than 26 weeks occurred in: January 1980 (43%), September 1980 (35%), October 1981 (32%), March 2008 (31%), September 2012 (30%), and January 2026 (29% thus far).
5
15
79
6,251
When #gold trades roughly 10% below its 200-day SMA, it has historically marked a strong reversal zone. This deviation has consistently signaled seller exhaustion, with prices typically bouncing back toward the trend line...
3
7
51
4,195
Bearish bets on #Gold have become extremely crowded as prices test major support at the March and recent lows ($4000–$4100). It feels like we’re approaching a bottom in precious metals and a top in Dixie.
2
2
2
38
2,574
The current #gold correction mirrors the 2008 pattern but is unfolding faster, meaning a 30% drop could bring prices down to $3,900.
3
4
1
39
6,804
#Gold is holding above the 38.2% Fib. supporting the view that Primary wave 4 remains intact and could still form a triangle or a zigzag. The recent tag of the lower Bollinger Band suggests a potential bottom, setting the stage for the next leg up in the larger trend.
2
8
58
5,911
Absolutely incredible: Minutes after the 10Y Note Yield rose to 4.43%, US officials said peace talks with Iran could come as soon as Thursday. However, yields continue to hold as skepticism over peace talks has grown, with the 10Y Note Yield now at 4.40%. Once again, we cannot afford the 10Y Yield nearing 5%.
289
706
130
4,170
534,174
Partial count for gold since the end of 2022. Wave P3 topped at 5602. Now in a multi-month P4 correction with key Fib levels: 23.6% at 4707, 38.2% at 4154. Currently an ABC pattern (A low ~4402), but could evolve into a more complex structure, extending further in time and price.
1
16
787
The perfect point to get into $NAMM. The next impulse will break through $10. No brainer because of the SPAC structure.
6
5
54
9,510
Lots of people puzzled by what Trump's up to but it'll all become clear when he takes Kamchatka
443
1,538
241
24,651
2,507,617
At least #Silver makes it easy to spot the top 😆 No - this is not the Grand rally. This is not Debasement. It was a Euphoric rally - where the Bulls tried to convince themselves of the reason - and the narrative. The real rally comes POST the Deflationary Bust
1
3
60
5,618
Over the past 25 years, #gold has topped out when the Fed Funds Rate (FFR) was at zero (on two occasions) and once when it reached 3%. Actually the FFR is at 3.50%-3.75%. There is still room for the gold price to rise...
9
730