

Cutting-edge platform designed to help traders streamline their decision-making process with a top-down market analysis to uncover high-potential opportunities.
Joined August 2024
- Tweets762
- Following83
- Followers4.2K
- Likes750




TradersLab retweeted

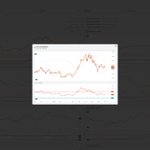
$CRDO $TER $LSCC $WOLF A few semis in the hardware related area have pulled back. This pullback is to their ER vwap, 50 day and 10/20 area. Nice, place to watch here. @TradersLab_

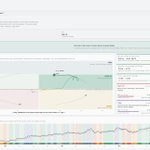
Big one just went live in TradersLab. 🧪
The Lab Report now connects the full @PrimeTrading_ workflow into one place:
Growth Cycle → Leaders → Setups
Start with the environment, identify where leadership is, then narrow it to the names actually in position to act.
The Leaders section combines daily + weekly extension, and the Setups section is now the main focus list I use for my own trading.
To walk through everything properly, I’m doing a LIVE webinar this Thursday at 11:00 AM ET covering the full process, how I use each section, and how they connect in real trading.
Event announcement coming shortly.
TradersLab → Lab Report
traderslab.io
This is a big step toward the goal with TLab: less noise, more structure, better decisions.


Most traders look for stocks first.
A better approach is often to find where the money is flowing first — then look for the best stocks inside those groups.
That’s exactly what ThemesLab is built for.
Instead of manually scanning dozens of industries, themes, and sub-groups, you can quickly see:
• Which themes are leading
• Which are improving
• Which are losing momentum
• Where relative strength is actually expanding
• The strongest stocks inside each group
The idea is simple:
Market → Theme → Stock
Start broad, identify where strength is concentrating, then drill down into the names actually driving it.
It makes top-down research much faster and helps avoid wasting time searching for leaders in groups that simply aren’t working.
If your process starts with “what stock should I buy?”, try flipping the question:
“Where is the market rewarding risk right now?”
That’s what ThemesLab is designed to help answer.
traderslab.io

Oversold ≠ Buy Signal
One of the most common mistakes newer traders make is treating an oversold reading as confirmation that a bottom is in.
It isn’t.
Oversold simply tells you the market is stretched. Selling pressure has become extreme enough that a reflex bounce is increasingly possible.
That is a condition, not a signal.
This is where two breadth indicators we use a lot at TradersLab become useful:
MCO = McClellan Oscillator
Think of it as short-term breadth momentum. It reacts relatively quickly to changes in the balance between advancing and declining stocks.
MCSI = McClellan Summation Index
Think of it as the broader breadth trend or regime. It moves more slowly and helps show whether participation across the market is generally expanding or contracting.
That distinction matters. An MCO hook higher from oversold can be constructive because it shows short-term breadth pressure is starting to improve.
But if MCSI is still falling, the broader breadth regime may still be contracting.
You can therefore have an MCO hook, a green index day, and even a sharp bounce while equal-weight price action, new highs/lows, and the percentage of stocks above key moving averages remain weak.
That is why oversold conditions should be treated as potential, not confirmation.
A cleaner sequence is:
Condition → Signal → Confirmation
Oversold creates the condition, and improving short-term breadth creates the signal.
Price, participation, and sustained breadth expansion provide the confirmation.
The goal is not to predict the exact bottom. It is to identify when the market is actually transitioning from contraction to expansion.
That is exactly what breadth analysis is designed to help with.
You can now track $QQQ, $SPY, $IWM and NYSE breadth dashboards for FREE on TradersLab, including MCO, MCSI, moving-average participation, new highs/lows, and more.
traderslab.io

TradersLab retweeted

@TradersLab_ is eons ahead of @TraderLion and @Deepvue and it is not close.
Depth of data, how the screens are built, what you can actually do with the output. Different tier of product.
People are sleeping on this. Or maybe it’s just the TL spray lord machine.
TradersLab now has a FREE tier.
It’s already live.
You can create an account and use:
• Market Overview
• TLMM breadth for SPY, QQQ, IWM & NYSE
• Top 10 Screener results
No need to jump straight into a paid plan just to see if the workflow fits you.
The free tier gives you enough to answer three important questions every day:
1. What is the market doing?
2. How healthy is participation underneath?
3. What stocks are showing up?
Then, if you want to go deeper into Themes, Relative Rotation, full Screener results, watchlists, leadership research, and the rest of the workflow, that’s where the full platform comes in.
Start using TradersLab for free → TradersLab.io

Macro Regime: neutral and drifting. Policy and risk appetite carrying it against energy.
Where we stand
Regime score: 52, mixed wind — down 5.0 on the week, 7.7 on the month
History: 47th percentile — close to a median day over the last five years
Lead engine: Policy (79, improving)
Drag engine: Inflation (23, weak)
What's driving it
Policy is the cleanest signal. 2Y at 3.76%, up only 3bps, while 2s10s sits at +103bps and steepened 9bps in three weeks — a rate path that isn't fighting the market.
Inflation is weak on energy alone. WTI 92.70, up 18.6% in 21 days; nat gas up 11.4%. The breakeven proxy has barely moved (+0.5%), so this is spot cost pressure, not repriced expectations yet.
Risk appetite at 75 is the largest positive contributor (+32.4% of the move off neutral). High-beta over low-vol up 3.8%, VIX at 14.53 and falling.
Market internals at 34 are the quiet problem. Only 38% of names above their 20DMA, 47% above the 50DMA.
Positioning read
Favors beta and policy-sensitive exposure while the curve stays cooperative.
Argues against duration extension — 10Y at 4.79%, up 12bps, with oil running behind it.
Argues for selectivity over breadth: 38% above the 20DMA means index strength is not participation.
Watch next
WTI at 92.70. Another leg up keeps inflation pinned and eventually erodes the policy tailwind holding this at neutral; a roll back toward the low 80s takes the drag off and lets the score reset higher.

One of the biggest mistakes swing traders make is looking at the index and assuming that tells the whole story.
That’s why we built the TLMM dashboard in TradersLab.
TLMM helps you track what’s happening under the surface:
• Breadth
• Trend participation
• Risk-on / risk-off conditions
• How many stocks are actually above key moving averages
• Whether momentum is broadening or deteriorating
The index can still look fine while participation underneath is weakening. On the flip side, breadth can start improving before price looks obvious.
The goal isn’t to predict every turn.
It’s to understand whether the market environment is actually supporting your trades. That context matters a lot when deciding how much exposure you want to carry.
TLMM for major indices is live on TradersLab.io

We just dropped a new video on how to use the Relative Rotation dashboard in TradersLab.
Compare one asset vs another to spot:
strength / weakness
divergence
correlation
ratio trends
historical extremes
custom ratios
AI analysis
A useful tool for understanding rotation under the surface.
🎥 youtu.be/rICUdULBwM4

Growth vs Value.
Instead of arguing about whether “growth is back,” just measure it.
The ratio tells you who is outperforming.
The normalized reading tells you how unusual that relative move is compared with history.
And the trend tells you whether leadership is actually improving or deteriorating.
That’s exactly what we built Relative Rotation for.

A stock, sector, or index can be going UP...
…and still be getting weaker.
That’s why absolute price only tells part of the story.
If $QQQ is +5%, but $SPY is +10%, Tech is actually losing relative strength.
Ratio analysis makes that visible immediately.
That’s the whole idea behind the new Relative Rotation dashboard in TradersLab.

NEW in TradersLab — Relative Rotation!! 🧪
One of the most requested features from our last community poll is now LIVE.
Compare one asset against another to uncover:
• Relative strength/weakness
• Rotation & divergences
• Historical extremes
• Ratio trends
• Different timeframes
• Built-in market relationships
• Your own custom ratios
• AI analysis
Tech vs Market.
Growth vs Value.
Small vs Large Caps.
Semis vs Market.
Discretionary vs Staples.
Equal Weight vs Cap Weight.
Price tells you what is moving.
Relative Rotation helps tell you WHERE the strength is moving.
Live now on TradersLab.io.

Markets are always rotating.
Growth → Value
Large Caps → Small Caps
Tech → Industrials
Risk-On → Defensive
The problem is that most traders only notice the rotation after it becomes obvious on the individual charts.
We built something for that.
Later today. 👀
Learn how to use the Screener Community Library in TradersLab to quickly find, explore, and use screens shared by the community.
youtu.be/ypmWTe5W6SQ
This quick walkthrough shows you how to browse popular screens, discover new ideas, and add useful screeners to your own process without starting from scratch.
Want access to the full TradersLab workflow?
Try TradersLab.io and explore the Screener Community Library today.
VERY AWAITED feature now live in TradersLab 👀
You can finally draw directly on the single-stock chart view.
Current support:
• Horizontal / trend lines
• Channels
• Fibonacci
• AVWAP
• Text
• Basic indicators
This is just the start. We’re nowhere near done.
More tools and indicators are coming over the next days & weeks.
If you use TradersLab, drop your requests in #feature-request of our free Discord — we want your input on what gets built next.
Tlab team ✌️

$QQQE still holding the rising 21dma-structure, while MCSI going sideway above a still rising 10dma.
Can the tech market find support here?


Macro Regime: policy carries it, inflation drags.
Where we stand
Regime score: 59, wind mixed (‑2.3 w/w, +0.5 m/m)
History: 77th percentile — firmer than roughly three of four days over the past five years
Lead engine: Policy, 81, strong
Drag engine: Inflation, 32, weak
Only 3 of 6 engines supportive
What's driving it
Policy: 2Y at 3.71%, down 9 bps, and 2s10s steepened to +103 bps (+13 bps over 21 days) — the rate path is cooperating rather than fighting.
Inflation: WTI 87.06 (‑5.6%) and gold 4,680.6 (+15.6%) pulling opposite ways. Energy softening while the hedge bid builds is not a clean disinflation read.
Risk Appetite, 76 and improving, explains +36.6% of the move off neutral. VIX 15.13, down 19.1%.
Growth, 62, holds constructive on copper +3.8%, but copper/gold is ‑10.1% in three weeks — the largest negative in the wind.
Positioning read
Favors duration and credit beta: the steepening curve plus HYG/LQD +0.8% says the funding side is intact.
Argues against pro-cyclical commodity and industrial tilt — industrials/SPY ‑4.5%, IWM/SPY ‑1.8%.
Watch next
Gold against crude. Gold bidding while WTI slides keeps Inflation a drag and pulls Growth with it; crude firming as gold cools is what flips the engine.

Learn how to use the Seasonality feature in TradersLab to quickly spot historical monthly and weekly tendencies, identify stronger seasonal windows, and add more context to your market and stock analysis.
In this quick walkthrough, we show you how the dashboard works, what to look for, and how to use seasonality as part of a smarter top-down process. If you want more tools like this for market internals, themes, screeners, watchlists, and top-down research, subscribe to TradersLab here: TradersLab.io
youtu.be/l9Dt7A0O6d0?si=D4w_… via @YouTube
🤖 Made with AI
