

We’re bringing Pride back to its roots, and we can’t wait to share it with you! 22-24 AUGUST 2025 NOTE - we're not on here anymore, so come find us on insta!
- Tweets189
- Following16
- Followers192
- Likes83


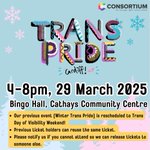






ALT A pink graphic with the Trans Pride Cardiff logo in the middle. Above the logo are the words 'we're going again!'. Below the logo the text reads '23rd - 25th August 2024. Send us feedback - link in bio!'

ALT A pink graphic with the Trans Pride Cardiff logo in the middle. Above the logo are the words 'we're going again!'. Below the logo the text reads '23rd - 25th August 2024. Send us feedback - link in bio!'


ALT A stand against Suella protest poster. It reads: Join Us in Protest to protect our community from the government's anti-LGBTQ+ agenda. WEDNESDAY 4TH OCTOBER 17:30 BETTY CAMPBELL STATUE, CARDIFF


ALT Colourful infographic depicting the following information: "88% of disabled people who attended Pride Cymru reported experiencing accessibility issues (12% experienced no accessibility issues). There were 144 separate reports of accessibility issues. This means that 49% of ALL people who responded to the survey have experienced accessibility issues."

ALT Infographic with the following text on it: "Pride Cymru became aware that wheelchair users were unable to navigate across the cobblestone at the castle on May the 12th. This was more than a month before the event was due to take place. They planned to use trackway to cover the cobbles and allow disabled access but due to the event clashing with Glastonbury and Download there was a shortage of tracking UK wide. Pride Cymru decided to spend £4,750 on rental wheelchairs and scooters to attempt to get disabled pride goers over the cobbles. Attendees weren't warned of these access challenges in advance, leaving many stuck on the day and unable to enter the event. 2024's Pride Cymru event is still planned to clash with Glastonbury, raising concerns that the same issue will arise again next year."

ALT Colourful infographic with pie charts. The title reads "do you have faith that Pride Cymru will listen to the community?" and the pie chart reads: "79% of trans, intersex, and nonbinary people have no faith that Pride Cymru will listen to the community", with those that have faith at 13% and those who are unsure at 8%. 42% of people over 40 have faith, compared to 15.2% of under 40s, 17.2& of disabled folks, and 14% of people of colour. The bottom text reads: "It is very common for disabled people to stop attending Pride Cymru because they experienced accessibility issues in previous years - this, taken with the fact that 77% of disabled people reported having no faith that Pride Cymru is interested in resolving the issues paints a damning picture that suggests disabled people will be less and less likely to attend over time unless swift action is taken."

ALT Colourful infographic with the following information: "Pride Cymru recived £35,000 from Cardiff Council through their 2023-24 FRM (Financial Resilience Mechanism) allocation. This was to help them move from the previous location, to the castle. The Welsh Goverment provided them with £50,000 in funding. This had no specific allocation, and was free for Pride Cymru to spend as they felt needed. This is concerning when local acts have told us that they were only paid £50 and many of the disabled people who paid for tickets were unable to get around the event."

ALT Colourful infographic with light blue background. The text reads: "Pride Cymru survey results! We surveyed a section of our community - largely LGBTQ people living in South Wales, on whether they would attend Pride Cymru, their thoughts on police marching in the parade, and their faith in Pride Cymru to listen to our concerns.

ALT Colourful infographic with pink background. The text reads: "of folks who had gone before but wouldn't again: 72% of people were disabled or had a long-term health condition, 70% reported personally experiencing accessibility issues, and 66% were trans, intersex, or nonbinary". Next to the text is a pie chart indicating the demographics of people who had been to Pride Cymru before but wouldn't again: intersex 3.1%, cis women 21.4%, cis men 11.2%, trans femmes 11.2%, trans mascs 28.6%, and non binary 24.5%

ALT A colourful infographic with light blue background and several pie charts. The text reads: "Do you plan on attending? 66% of people over 40 said they planned to attend, while only 36% of people under 40 were. These folks answered yes: 88% cis folks, 48% gay men, 37% trans, intersex, and non-binary (TIN) folks, 30% lesbians, 29% people of colour, and 24% trans people of colour (PoC). People of colour are the least likely to attend, the least likely to support having the police march, and the least likely demographic to have faith that Pride Cymru are interested in resolving the issues - so where does this leave Pride Cymru's statement from June 2020 on 'how to show support and fight for [Black folks'] fundamental rights'?"

ALT Colourful infographic with light blue background and watercolour pie charts. The title reads "these folks said ACAB", and the information is as follows: "Those who did not want police to march in the parade, 47% of cis men, 63% of LGBQ people, 78% of cis women, 95% of TIN folks, 96% PoC, and 100% of trans PoC. 91% of people under 40 did not want the police to march in the parade. The majority of people who want the police in the parade were cisgender white gay men, many of whom report they do not attend Pride Cymru themselves. Lesbians, asexual, demisexual, and aromantic people unanimously agreed that police should not march, with not insignificant demographic numbers (30 lesbians and 36 ace/aro folks).


ALT A photograph of two trans flags held aloft against a cloudy sky


ALT A photograph of two trans flags held aloft against a cloudy sky


ALT A photograph of two trans flags held aloft against a cloudy sky


ALT A photograph of two trans flags held aloft against a cloudy sky

ALT A photograph of two trans flags held aloft against a cloudy sky