

A Degen Trader's Paradise, by @0xKaroshi Multi-chain token intelligence platform. 6 engines · 500+ data points. UnBag now ↓
Joined April 2026
- Tweets251
- Following1
- Followers371
- Likes41




Pinned Tweet
$UNBAG is live.
CA: B8iv48voSh8C2BQ7QrEFKMji3K45ZWNMag3TULYRpump
The token of unbag.me — the token intelligence layer. Scan any CA across 5 chains: contract hygiene, holder intelligence, AI-slop detection, live trajectory. Free, no signup.
This is the only real $UNBAG.
Receipts: unbag.me/transparency


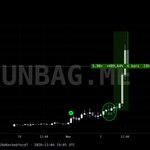
This is why we love our Volume Glyphs. 📈
robinhood:0x6511c233790ec10f7d673c64dc82c3f941d57828 kept printing volume signals at different stages of its rally, while market cap climbed towards $620K.
Multiple opportunities to spot rising activity, right on the chart.
And Volume Glyphs are FREE on @UnBagMe.
Stop watching price alone. Start watching volume.


If you're still trading without @UnBagMe, you're probably missing moves like this.
Our Volume Glyphs picked up a volume expansion on $ZKBLAST before it went on to rally 5.9x in just 23 hours. 🔥
The market keeps moving. Make sure you're watching the right signals.

If you're still trading without @UnBagMe, you're probably missing moves like this.
Our Volume Glyphs picked up a volume expansion on $ZKBLAST before it went on to rally 5.9x in just 23 hours. 🔥
The market keeps moving. Make sure you're watching the right signals.
Our Volume Glyphs on @UnBagMe spotted the volume expansion on robinhood:0x15f3385625d7e364c5a6216fbbceadf10fa90e7d before it went on a massive rally.
What followed?
> 28.73x
> +2,772.70%
> 26 days.
This is the kind of market activity our Volume Glyphs are built to help you spot. 🚀

Our Volume Glyphs on @UnBagMe spotted the volume expansion on robinhood:0x15f3385625d7e364c5a6216fbbceadf10fa90e7d before it went on a massive rally.
What followed?
> 28.73x
> +2,772.70%
> 26 days.
This is the kind of market activity our Volume Glyphs are built to help you spot. 🚀


You can also claim a token by sending /updateinfo to our TG/Discord bot.
Or update directly via our web app: unbag.me

What if you could spot volume expansion before a breakout becomes obvious?
$GATO gives us a good example.
Volume Glyphs highlighted increased activity around October 19, ahead of the token's move from roughly $1.7M to over $10M market cap.
A second signal appeared during the latest leg higher.
This is exactly why we added Volume Glyphs to @UnBagMe Smart Charts.
They appear when volume crosses its 20MA.
And yes, they're FREE. 🔥

Try it now: unbag.me?utm_source=x

When we started building 'Scout AI' over a month ago, our primary objective was to identify market patterns, and build a profitable calling strategy that develops itself with time.
We used multiple data points from several on-chain, intel and social media sources to build a working system that we called Scout AI.
Today marks the completion of one month of learnings, pattern-watching, data curation and trade alerts, fed directly to our PRO and Whale member feeds.
Here are the honest results which we're constantly working to improve as our AI model keeps learning new patterns and strategies over time.

Pro/Whale Tiers - unbag.me/pricing

UnBagMe retweeted

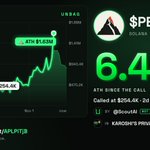
Scout AI by @UnBagMe has been on a roll since day 1.
I have tested many AI bots, many strategies to take hold of the trenches but most of them have failed after a while.
On the other hand 'Scout AI' has been consistently killing on one metric - 'Finding the runners WAY BEFORE they start getting mainstream attention'.
Here's another one from Scout.
Scout AI is available for all PRO members on @UnBagMe , and for Karoshi's Private members.


We caught the top on ethereum:0x4e67db19044549ff420860834c91b45bad298722 via our 'Top Signal' indicator on @UnBagMe.
The trigger fired on October 5.
Our indicator automatically plotted the potential short/sell zone between $17.83M and $25.84M.
Since then, ethereum:0x4e67db19044549ff420860834c91b45bad298722 has crashed 99.76% in 14 days.
What are you scanning today? 👀

A good example of how our Top Signal indicator helps identify potential distribution setups.
$ORBIO triggered a Top Signal on October 6.
After rejecting the marked short/sell area near $72.55M mcap, price entered a sustained downtrend.
The result?
> 78.45% decline
> 20 days
Currently trading below $25M mcap.
What are you scanning with @UnBagMe?
