

Founded one of the first synthetic grass & golf systems companies in the US in 1998. I consult on large golf systems projects world-wide. Avid crypto investor.
Joined January 2022
- Tweets15.9K
- Following482
- Followers7.9K
- Likes23.8K



We are currently seeing another correction and all assets are doing so, some more than others. When big players decide to short, there’s not much retail
can do about it.
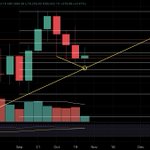
$BTC can still drop to the macro trend support tonight. I mentioned this a as a possibility in a previous post.
Once we see price acceptance above that macro support trend line, that’s when I would expect the market to truly start a reversal to the upside.
If, for whatever reason, price loses the macro trend support with acceptance, I’ll reevaluate at that point.

Once $LTC has reached a key point of resistance, such as a trend line, I switch to lower time frames (30M in this case) to see details of the moves.
You can see we had a Livermore pivot that pushed through and failed and then a second one that pushed through, retested and bounced.
It might be working on a second retest currently. It will either bounce again or fall back through the trend line if it attempts a touch again.

$ZEC price has pushed up into daily HTF resistance at the .5 fib level for the 5th time. The current price has touched that level on volume that's below the VMA (volume moving average).
At a HTF resistance level you want to see expanding volume that's higher than the VMA.

#ALGO is showing nice price acceptance at the level it needs to, the .5 fib retracement. The four previous wicks below this level, on the daily, have reclaimed the level and finished with a candle body above it.
Price is currently working on the fifth body candle above this level. This is what you want to see for price acceptance at key support.

$LTC hit my target zone, started following this ascending trend line and has now made a nice move into the descending trend line.
I'd like to see candle volume expand as it tries to push through this resistance.
Litecoin is currently in the top three movers for the day in the top 50 assets.

Nice move up for $BTC after the Warsh meeting. Bullish RSI divergence is still present on the 4H chart and the current bullish volume candle is stronger than the MA.
I want to see Bitcoin make a higher high and accept price above the previous high. If it accomplishes that, it's possible that the low of $79,107 is in, which I'm pleased with as that's close enough to my target of $78,500, holding above the macro trend support.
I want to see the next 4H candle expand beyond the current one as that type of volume expansion is an indicator of bullish strength. If price fails to make a higher high, it's still possible to come down and tag the macro trend support.

The current weekly chart for $BTC shows three downward wicks that align perfectly with a trend line that intersects the 9 year trend support line right below the current candle.
Is this intersection an indicator of where price might wick down to? The price is about $78,587 where the two trend lines cross, just above the .702 fib level.
Using analysis like this is how you create your "best guess" as to where price might go!😊

It's a difficult day to predict price movement with the FOMC rate decision at 2:00 pm Eastern time. Even though the odds favor a pause, anything can happen.
Anyone who says they can tell you what price action will do leading up to that or afterwards is guessing.
If you're wanting to make a swing trade, the best strategy is to always wait for price to settle in and accept above or below key levels first.
#tradingstrategy #cryptocurrency #Investing
I don't typically chart $NEAR but this is an example of another asset that showed a 288% rise in price since late August.
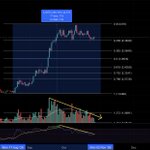
Since it peaked, both the daily RSI and volume are showing the same type of bearish divergence as $ZEC.
These are typical fundamentals that appear when an asset has gone parabolic without proper corrections on the way up. I see a classic Wyckoff distribution top with a clear SOW (sign of weakness) followed by a UTAD (upthrust after distribution).
A correction back down to the .618 fib level at around $2.60 would be the healthiest move this asset could make if people are wanting higher highs and bulls step in there.
Decreasing volume and RSI are indicators of decreasing participation.

Once again, when looking at the chart fundamentals for $ZEC relative to the price action since August 22, I can't stress enough that these need to be paid attention to.
Currently, price is rising on below average daily volume as indicated by the volume MA. You also have bearish divergence in both the daily RSI and overall volume.
The market makers are floating the price on this due to the heavy leverage players and FOMO buyers. It's the easiest asset in crypto to move in large chunks because of this.
Proceed with caution as the fundamentals need to be in your favor before you commit to a trade or investment!

The fact that we've seen twelve 3 day candle body closes above 80k for $BTC is strong price acceptance above that level and confirms to me that it's highly unlikely price falls to lower levels like many are calling for.
A liquidation wick down to my target of around $78,500 is very doable and you will most likely see a very quick reclaim back above 80K. Once this liquidation happens, it should be much easier for price to start rising to higher levels. The market is shaking out as many leverage traders as possible before moving higher.
A big percentage of the retail crowd is looking for lower levels and this is one of the things that convinces me we probably won't see that. When you consider the 9 year macro trend support as part of the equation, it's going to take a ton of bearish volume to take price acceptance below that level.
An almost decade long trend support or resistance level is always the strongest indicator over all others. Price has only lost this line temporarily during Covid (with a quick reclaim back above) and recently when it dipped below it for 78 days and then reclaimed it quite easily on the last green candle
I have yet to personally see any other analyst that is considering this trend line as most are using the linear scale chart, where you will not see this trend line. It's a recognized rule that analysts should always use the log scale chart when looking at macro price movement.

I've adjusted the upper rail of the macro, rising wedge for $ZEC, after recent price action, as it makes more sense seeing price track along the structure midpoint.

Let's see what targets there might be for $BTC if it is to retrace to roughly the .702 fib level around $78,500.
On a micro fib layout, it's common to see price push up to a 1.618 extension. That would be around 100K.
That's an even psychological number and common fib extension so it's a logical assumption price hits that level.
Look for a correction if price goes there.

A combination of the 46 year cup and handle structure, current wedge structure, and the .618 fib retest level at the top of the handle are all indicators of a $50 touch and huge expansion, as high as $700, for $SILVER!
Phenomenal buying opportunity in my opinion so I'm loading up! Don't expect this price target in 3 months BTW!


algorand:native still looking very nice with this cup and handle formation as the 200 SMA is simply additional support, at a key level, for where it's at on the daily chart.
For those of you newer to my analysis on this asset, I've included the macro chart so that you can see that this is a multi-year wedge pattern. Those structures often expand substantially after a structure break.

Based on $BTC's current movement, it could simply make more of a time based correction into the 9 year macro trend support, similar to what it did on the previous touch, somewhere around 79K.
Regardless of how this retest plays out, my overall thesis has always been that this macro support structure should hold price, as it's done many times before over multiple years, even if price wicks slightly below it.

$BTC dominance is having trouble working through the upper rail of this symmetrical triangle structure. Are we about to see dominance fall to the lower rail, which would indicate a good push from alts?
Price would have to push below the midpoint level of the larger, rising parallel structure to get there as that's the more dominant structure.
A push down through the triangle itself, to the lower rail of the larger structure, would mean an even larger push by alts.
This would put price at a key level as a break through that lower rail, with price acceptance, could be the indication of the beginning of an altseason.
$altcoins #structure #analysis #TA

An $ICP push down to $2.50 at the .618 fib level is reasonable, in my target zone, and still maintains a higher low with the overall uptrend on the daily chart.
