

Founder/CEO of ModernIR and Market Structure EDGE LLC. Invented Market Structure Analytics for IR. Expert on equity market structure.
Denver, CO
Joined August 2015
- Tweets4K
- Following239
- Followers3.5K
- Likes594




$CAT down ~12% premarket. That SHOULD be a 400+ pt decline for $DJIA futures? @SullyCNBC @TripleDTrader @JoeSquawk (I've said for two years that the broad measures are broken thanks to 0DTE options. It's a delta/gamma trade, not an index.)

Every now and then I write about #economics and #monetary policy -- both of which clear rooms at cocktail parties, much like #marketstructure: modernir.com/wheelbarrows/

Always fun! To me, two keys here: We've been told hedge funds were short the market. They were not. At lest yet. Broad Sentiment is peaked and hot, and nobody knows it. Don't be caught out.

Is the stock market being propped up by options hedging?
Market Structure Edge founder Tim Quast joined the PreMarket Prep team to explain why volatility is surging under the surface, what short volume reveals about real demand, and how he’s positioning ahead of big tech earnings. Check it out.
@_TimQuast @TripleDTrader @Spus $AMZN $GOOG $MSFT $INTC


You think there's a chance a #risk management system managing $25T of assets might foster lockstep behavior? Like moving to #healthcare? modernir.com/the-genie/

#inflation data from @MinneapolisFed 1800-1900: -55%. Everything became less expensive. Proof that as Kevin Warsh says, inflation is a CHOICE. Inflation 1913-2026: +3.3% annually, total 371%. Cause: @federalreserve. Too much month at the end of the money. @GunjanJS
Whether #inflation data or #options resets for October are reasons for the market's gurgling today, the market behaves like an arbitrage because #stocks are principally collateral for #ETFs. And next, #tokens. modernir.com/taking-a-toll/


Tim Quast retweeted

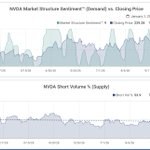
Tim Quast, Founder/CEO of ModernIR and Market Structure EDGE breaks down the supply and demand data behind Nvidia, Micron, Dell, SpaceX, Verizon, AT&T, Oracle, Constellation Energy and more on today's PreMarket Prep. Check it out.
$NVDA $MU $SPCX $VZ $T $ORCL $LLY $CEG
@_TimQuast @TripleDTrader
Back from riding bikes in Portugal, back from NYC, and on #PremarketPrep today, 835a ET! Come join: youtube.com/watch?v=jM0xdDA7…
I'm on panel #3 today at the SEC Roundtable on 24-hr trading. See the webcast/replay at sec.gov. I've filed these comments: modernir.com/continuous-trad…
Tim Quast retweeted
24/7 Stock Trading Is Coming
Tim Quast, Founder and CEO of Market Structure EDGE joined us on PreMarket Prep to talk about an SEC roundtable Thursday on 24-hour trading in Washington that he's attending.
He was invited by Jamie Selway, the SEC's head of trading and markets, specifically to represent public-company/issuer interests.
- The 24-Hour Trading Problem
- ETF Mechanics & the Bigger Picture (Tokenization)
- Market Structure Edge's Read Going Into Quad Witching
- "Focus Fives" model portfolio
@_TimQuast @TripleDTrader @Spus
Let's talk stocks and 24-hr trading and the AI trade -- and more! See you soon: youtube.com/live/2dYzVry7FiQ

30D Demand/Supply for #software vs #semiconductors. Software is stronger but declining, and has higher Supply (over 53% short volume). Semi Demand stalled below 5.0 and Supply (45.7%) shows an upturn. It's not bad -- but they COULD move the same direction.

The simplest explanation for market weakness is Demand has dropped below 5.0 for the first time since May. That's also the second-longest stretch since 2017 for Demand at 5.0 or better. In May, Supply fell, stocks rose -- and then plunged in early June.

Investors, it's important to know how LULD works. Don't be lulled! modernir.com/smooth-operator…
