

Where Aeronautics meet AstroEconomics. Macro, SPY and VIX focus. Home of VAXTRO, ORM Oscillator, and VIX Ladder. Premium Content / Substack Members: Link Below.
Garden City, MI
Joined September 2016
- Tweets16.8K
- Following240
- Followers21.4K
- Likes13.4K




Pinned Tweet
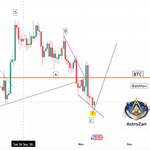
$SOXX — 𝗧𝗼 𝗧𝗵𝗼𝘀𝗲 𝗪𝗵𝗼 𝗗𝗼𝘂𝗯𝘁 𝗧𝗵𝗲 𝗕𝗼𝘁𝘁𝗼𝗺. 11/01/26
𝗬𝗲𝘀, the May–November rising support (maroon line) has broken. Even the much older ascending black trendline has been violated. But 𝗱𝗼𝗻'𝘁 𝗰𝗼𝗻𝗳𝘂𝘀𝗲 𝗮 𝗯𝗿𝗼𝗸𝗲𝗻 𝘀𝘁𝗿𝘂𝗰𝘁𝘂𝗿𝗲 𝘄𝗶𝘁𝗵 𝗮 𝗯𝗿𝗼𝗸𝗲𝗻 𝗺𝗮𝗿𝗸𝗲𝘁.
𝗧𝗵𝗲 𝗿𝗲𝗮𝗹 𝘀𝘁𝗼𝗿𝘆 𝗶𝘀 𝘁𝗵𝗲 𝗩𝗪𝗔𝗣. My anchored VWAP near $459.40 caught Friday's capitulation wick almost perfectly. Price rebounded roughly $14 from that level into the close. See the red ellipse and where price bottomed; perfection!
As discussed yesterday, $SOXL's net volume surged from −20% to +5% during the final two trading hours. That is a remarkable shift in buying pressure amid apparent technical destruction and fear.
𝗠𝘆 𝗶𝗻𝘁𝗲𝗿𝗽𝗿𝗲𝘁𝗮𝘁𝗶𝗼𝗻: Capitulation, absorption, and a potential transfer of control back to buyers.
𝗧𝗵𝗲 𝗯𝗲𝗮𝗿𝘀 𝘀𝗲𝗲 𝗯𝗿𝗼𝗸𝗲𝗻 𝗹𝗶𝗻𝗲𝘀. 𝗜 𝘀𝗲𝗲 𝗮 𝗩𝗪𝗔𝗣 𝗱𝗲𝗳𝗲𝗻𝗱𝗲𝗱. As long as ~$459 holds, the opportunity remains for $SOXX to reclaim the broken trendlines and reenter the upper triangular structure.
𝗧𝗼𝗱𝗮𝘆'𝘀 𝗯𝗿𝗲𝗮𝗸𝗱𝗼𝘄𝗻 𝗰𝗼𝘂𝗹𝗱 𝗯𝗲 𝘁𝗼𝗺𝗼𝗿𝗿𝗼𝘄'𝘀 𝗯𝗲𝗮𝗿 𝘁𝗿𝗮𝗽.
I'm constructive on $SOXX and $SOXL. The VWAP is my line in the sand. The market maker will provide you with the bullish narrative leading into the midterms.
Share & Subscribe, <link in bio>.
$SPY $QQQ $IWM $MDY $RUT $DIA $SDOW $SOXX $SOXS $SMH $NVDA $TSLA $YINN $VIX $VXX $TLT $BTC $GLD $SLV $SVXY $DRAM $SNDK $MU $EWJ $EWY

The $NVDA Compressed Spring, more context below ⏬️

🟢🟢 𝗖𝗔𝗧𝗘𝗥𝗣𝗜𝗟𝗟𝗔𝗥 𝗜𝗦 𝗕𝗔𝗖𝗞! $CAT | 11/09/26 🌑
🟢 $CAT is 𝗦𝗘𝗥𝗜𝗢𝗨𝗦𝗟𝗬 𝗚𝗥𝗘𝗘𝗡 for the first time since early October!
🌑 𝗧𝗛𝗘 𝗣𝗢𝗪𝗘𝗥 𝗢𝗙 𝗧𝗛𝗘 𝗡𝗘𝗪 𝗠𝗢𝗢𝗡 — November 9, a potential reversal force in action!
📈 $CAT's strength is offsetting roughly 𝗧𝗪𝗜𝗖𝗘 the negative impact of $NVDA on the Dow Jones.
🚀 𝗧𝗛𝗘 $NVDA 𝗖𝗢𝗠𝗣𝗥𝗘𝗦𝗦𝗘𝗗 𝗦𝗣𝗥𝗜𝗡𝗚
I see NVIDIA's current weakness as a compressed spring. If the Jensen Huang ordeal concludes with confirmation of 𝗡𝗢 𝗡𝗔𝗧𝗜𝗢𝗡𝗔𝗟 𝗦𝗘𝗖𝗨𝗥𝗜𝗧𝗬 𝗧𝗛𝗥𝗘𝗔𝗧, the resulting relief rally could propel $NVDA, $SOXL and $SOXX sharply higher.
𝗧𝗛𝗘 𝗦𝗘𝗧𝗨𝗣: Dow leadership broadens while semiconductor upside potential builds beneath the surface. Remember that $SOXX can lead and bottom before $SPY even if you think SPY may go a bit lower extending a WAVE C ⚠️
Share & Subscribe, <<link in bio>>.
$SPY $QQQ $IWM $MDY $RUT $DIA $SDOW $SOXX $SOXS $SMH $NVDA $TSLA $YINN $VIX $VXX $TLT $BTC $GLD $SLV $SVXY

🟢🟢 𝗖𝗔𝗧𝗘𝗥𝗣𝗜𝗟𝗟𝗔𝗥 𝗜𝗦 𝗕𝗔𝗖𝗞! $CAT | 11/09/26 🌑
🟢 $CAT is 𝗦𝗘𝗥𝗜𝗢𝗨𝗦𝗟𝗬 𝗚𝗥𝗘𝗘𝗡 for the first time since early October!
🌑 𝗧𝗛𝗘 𝗣𝗢𝗪𝗘𝗥 𝗢𝗙 𝗧𝗛𝗘 𝗡𝗘𝗪 𝗠𝗢𝗢𝗡 — November 9, a potential reversal force in action!
📈 $CAT's strength is offsetting roughly 𝗧𝗪𝗜𝗖𝗘 the negative impact of $NVDA on the Dow Jones.
🚀 𝗧𝗛𝗘 $NVDA 𝗖𝗢𝗠𝗣𝗥𝗘𝗦𝗦𝗘𝗗 𝗦𝗣𝗥𝗜𝗡𝗚
I see NVIDIA's current weakness as a compressed spring. If the Jensen Huang ordeal concludes with confirmation of 𝗡𝗢 𝗡𝗔𝗧𝗜𝗢𝗡𝗔𝗟 𝗦𝗘𝗖𝗨𝗥𝗜𝗧𝗬 𝗧𝗛𝗥𝗘𝗔𝗧, the resulting relief rally could propel $NVDA, $SOXL and $SOXX sharply higher.
𝗧𝗛𝗘 𝗦𝗘𝗧𝗨𝗣: Dow leadership broadens while semiconductor upside potential builds beneath the surface. Remember that $SOXX can lead and bottom before $SPY even if you think SPY may go a bit lower extending a WAVE C ⚠️
Share & Subscribe, <<link in bio>>.
$SPY $QQQ $IWM $MDY $RUT $DIA $SDOW $SOXX $SOXS $SMH $NVDA $TSLA $YINN $VIX $VXX $TLT $BTC $GLD $SLV $SVXY
Astro Zan retweeted
🌑🌱 𝗡𝗘𝗪 𝗠𝗢𝗢𝗡 — 𝗠𝗢𝗡𝗗𝗔𝗬, 𝟭𝟭/𝟬𝟵/𝟮𝟲. 𝗚𝗥𝗘𝗘𝗡 𝗦𝗛𝗢𝗢𝗧𝗦. $NVDA
The New Moon arrives Monday, November 9, at a potentially pivotal moment for the markets.
🎯 𝗠𝗬 𝗙𝗢𝗥𝗘𝗖𝗔𝗦𝗧:
The iconic 𝗚𝗥𝗘𝗘𝗡 of the NVIDIA logo may very well match the color of $SPY's closing candle tomorrow.
With corrective 𝗪𝗮𝘃𝗲 𝗖 potentially nearing exhaustion and major long-term technical support being tested, the setup favors the emergence of 𝗚𝗥𝗘𝗘𝗡 𝗦𝗛𝗢𝗢𝗧𝗦 𝗜𝗡𝗧𝗢 𝗧𝗛𝗘 𝗖𝗟𝗢𝗦𝗘.
⚠️ 𝗧𝗛𝗘 𝗡𝗘𝗚𝗔𝗧𝗜𝗩𝗘 𝗡𝗘𝗪𝗦 — 𝗧𝗪𝗢 𝗣𝗢𝗦𝗦𝗜𝗕𝗟𝗘 𝗢𝗨𝗧𝗖𝗢𝗠𝗘𝗦:
🔹 𝗖𝗔𝗣𝗜𝗧𝗨𝗟𝗔𝗧𝗜𝗢𝗡: The headlines trigger a final wave of panic selling, flushing out weak hands into major technical support.
🔹 𝗕𝗨𝗟𝗟𝗜𝗦𝗛 𝗧𝗛𝗥𝗨𝗦𝗧: The market recognizes that the controversy may ultimately prove to be a personal ordeal rather than a material threat to NVIDIA's underlying business. An unexpectedly limited business impact could fuel a sharp reversal as fear unwinds.
𝗧𝗵𝗲 𝗸𝗲𝘆 𝗶𝘀 𝗻𝗼𝘁 𝗺𝗲𝗿𝗲𝗹𝘆 𝘁𝗵𝗲 𝗻𝗲𝘄𝘀, 𝗯𝘂𝘁 𝗵𝗼𝘄 𝘁𝗵𝗲 𝗺𝗮𝗿𝗸𝗲𝘁 𝗿𝗲𝗮𝗰𝘁𝘀 𝘁𝗼 𝗶𝘁.
🌱 𝗡𝗘𝗪 𝗠𝗢𝗢𝗡. 𝗡𝗘𝗪 𝗖𝗬𝗖𝗟𝗘. 𝗣𝗢𝗧𝗘𝗡𝗧𝗜𝗔𝗟 𝗥𝗘𝗩𝗘𝗥𝗦𝗔𝗟.
Share & Subscribe, <link in bio>.
$SPY $QQQ $IWM $MDY $RUT $DIA $SDOW $SOXX $SOXS $SMH $NVDA $TSLA $YINN $VIX $VXX $TLT $BTC $GLD $SLV $SVXY $DRAM $SNDK $MU $EWJ $EWY

Astro Zan retweeted
🚨🚨🚨 𝗦𝗛𝗢𝗨𝗟𝗗 𝗬𝗢𝗨 𝗦𝗘𝗟𝗟 $NVDA 𝗧𝗢𝗡𝗜𝗚𝗛𝗧?
📈 𝗔𝗜𝗤 — 𝗛𝗢𝗟𝗗𝗜𝗡𝗚 𝗟𝗢𝗡𝗚-𝗧𝗘𝗥𝗠 𝗦𝗨𝗣𝗣𝗢𝗥𝗧
November 8, 2026 | AI & Technology Index
𝗧𝗵𝗲 "𝘁𝗶𝗺𝗶𝗻𝗴" 𝗼𝗳 𝘁𝗵𝗲 $NVDA 𝗻𝗲𝘄𝘀 𝗺𝗮𝘆 𝗯𝗲 𝗺𝗼𝗿𝗲 𝘀𝗶𝗴𝗻𝗶𝗳𝗶𝗰𝗮𝗻𝘁 𝘁𝗵𝗮𝗻 𝘁𝗵𝗲 𝗻𝗲𝘄𝘀 𝗶𝘁𝘀𝗲𝗹𝗳.
Consider this remarkable confluence of events:
🔹 𝟭. 𝗡𝗘𝗪 𝗠𝗢𝗢𝗡 — 𝗡𝗢𝗩𝗘𝗠𝗕𝗘𝗥 𝟵
Tomorrow marks a New Moon, an astronomical event I monitor as a potential timing window for a market reversal.
🔹 𝟮. 𝗧𝗛𝗘 𝗧𝗔𝗜𝗟 𝗘𝗡𝗗 𝗢𝗙 𝗪𝗔𝗩𝗘 𝗖
The news emerges precisely as corrective Wave C appears to be approaching exhaustion.
Not two weeks ago. Not after earnings. But this weekend, at a critical technical and timing juncture.
🔹 𝟯. $NVDA 𝗘𝗔𝗥𝗡𝗜𝗡𝗚𝗦 𝗔𝗣𝗣𝗥𝗢𝗔𝗖𝗛𝗜𝗡𝗚
The headlines arrive roughly a week ahead of anticipated NVIDIA earnings, when investor sensitivity is already elevated.
🎯 𝗧𝗛𝗘 𝗕𝗜𝗚𝗚𝗘𝗥 𝗣𝗜𝗖𝗧𝗨𝗥𝗘
Is this timing merely coincidental, or does the narrative amplify fear precisely when weak hands are most vulnerable?
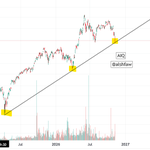
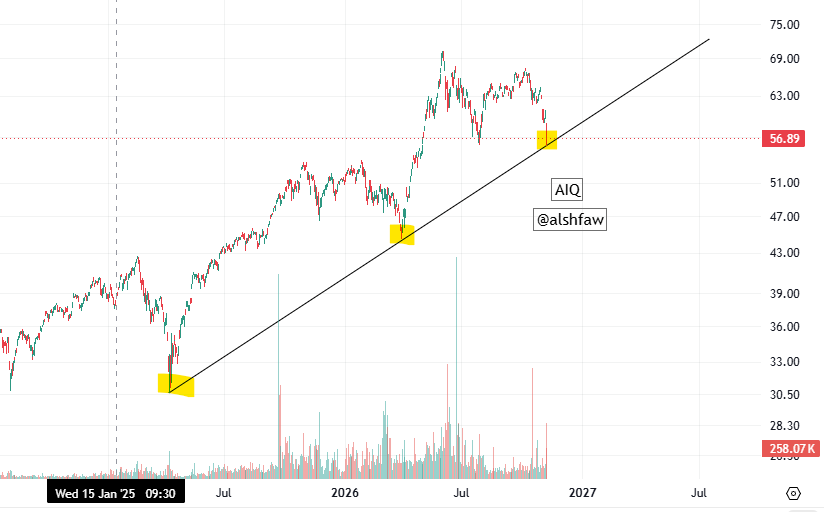
The attached $AIQ chart shows price testing its 𝗹𝗼𝗻𝗴-𝘁𝗲𝗿𝗺 𝗮𝘀𝗰𝗲𝗻𝗱𝗶𝗻𝗴 𝘀𝘂𝗽𝗽𝗼𝗿𝘁 for the third time.
My interpretation is that the immediate pressure is directed less at @JensenHuang personally and more at 𝗶𝗻𝘃𝗲𝘀𝘁𝗼𝗿 𝗰𝗼𝗻𝗳𝗶𝗱𝗲𝗻𝗰𝗲.
𝗧𝗛𝗘 𝗣𝗢𝗧𝗘𝗡𝗧𝗜𝗔𝗟 𝗢𝗨𝗧𝗖𝗢𝗠𝗘?
Shareholders surrendering their $NVDA positions into major technical support, just as the corrective cycle may be nearing completion.
This timing deserves scrutiny!
⚠️ 𝗪𝗔𝗧𝗖𝗛 𝗧𝗛𝗘 𝗦𝗨𝗣𝗣𝗢𝗥𝗧.
𝗪𝗔𝗧𝗖𝗛 𝗧𝗛𝗘 𝗧𝗜𝗠𝗜𝗡𝗚.
𝗪𝗔𝗧𝗖𝗛 𝗧𝗛𝗘 𝗥𝗘𝗔𝗖𝗧𝗜𝗢𝗡.
$182 $NVDA is a Fortress price area. $AIQ agrees for now.
Share & Subscribe, <link in bio>.
$SPY $QQQ $IWM $MDY $RUT $DIA $SDOW $SOXX $SOXS $SMH $NVDA $TSLA $YINN $VIX $VXX $TLT $BTC $GLD $SLV $SVXY $DRAM $SNDK $MU $EWJ $EWY
Astro Zan retweeted
🚨🚨🚨 𝗘𝗦 𝗙𝗨𝗧𝗨𝗥𝗘𝗦 — 𝗧𝗛𝗘 𝗟𝗢𝗡𝗚-𝗧𝗘𝗥𝗠 𝗕𝗨𝗟𝗟𝗜𝗦𝗛 𝗧𝗥𝗘𝗡𝗗 𝗜𝗦 𝗜𝗡𝗧𝗔𝗖𝗧!
📅 November 7, 2026
📈 𝗧𝗛𝗥𝗘𝗘 𝗣𝗢𝗜𝗡𝗧𝗦. 𝗢𝗡𝗘 𝗕𝗨𝗟𝗟𝗜𝗦𝗛 𝗧𝗥𝗘𝗡𝗗.
The $ES weekly chart continues to respect its long-term ascending support line connecting the April 2025 Liberation Day bottom, March 2026 corrective low, and November 2026 retest.
Unlike the recent structural weakness in $SPY, futures are still defending this critical bullish trendline. See chart.
⚡ 𝗠𝗢𝗡𝗗𝗔𝗬'𝗦 𝗩𝗢𝗟𝗔𝗧𝗜𝗟𝗜𝗧𝗬 𝗦𝗘𝗧𝗨𝗣
#VIX1D closed Friday elevated, creating the potential for a sharp volatility crush Monday morning and a stronger $SPY opening at 9:30 AM EST.
🔥 𝗧𝗛𝗘 𝗦𝗤𝗨𝗘𝗘𝗭𝗘 𝗦𝗘𝗧𝗨𝗣
@fundstrat's bullish outlook is warranted, in my view.
Even if Monday delivers a final mini flash crash to clear remaining liquidity, the deeply depressed 𝗦𝗤𝗨𝗘𝗘𝗭𝗘 𝗜𝗡𝗗𝗘𝗫 favors a powerful mean-reversion rally once selling pressure exhausts itself.
🎯 𝗠𝗬 𝗕𝗔𝗦𝗘 𝗖𝗔𝗦𝗘: An upside squeeze, potentially preceded by one final downside liquidity sweep.
A sustained loss of the rising support line would challenge this outlook.
𝗧𝗛𝗘 𝗦𝗤𝗨𝗘𝗘𝗭𝗘 𝗜𝗦 𝗠𝗬 𝗣𝗥𝗘𝗙𝗘𝗥𝗥𝗘𝗗 𝗦𝗖𝗘𝗡𝗔𝗥𝗜𝗢.
Share & Subscribe, <<link in bio>>.
$SPY $QQQ $IWM $MDY $RUT $DIA $SDOW $SOXX $SOXS $SMH $NVDA $TSLA $YINN $VIX $VXX $TLT $BTC $GLD $SLV $SVXY

✅ 𝗕𝗧𝗖 — 𝗧𝗛𝗘 𝗔𝗕𝗖 𝗖𝗢𝗥𝗥𝗘𝗖𝗧𝗜𝗢𝗡 𝗜𝗦 𝗖𝗢𝗠𝗣𝗟𝗘𝗧𝗘!
November 8, 2026
📈 𝗧𝗛𝗘 𝗘𝗟𝗟𝗜𝗢𝗧𝗧 𝗪𝗔𝗩𝗘 𝗦𝗧𝗥𝗨𝗖𝗧𝗨𝗥𝗘
My comprehensive Elliott Wave analysis of $BTC indicates that the 𝗔𝗕𝗖 𝗰𝗼𝗿𝗿𝗲𝗰𝘁𝗶𝘃𝗲 𝘀𝗲𝗾𝘂𝗲𝗻𝗰𝗲 𝗵𝗮𝘀 𝗿𝗲𝗮𝗰𝗵𝗲𝗱 𝗰𝗼𝗺𝗽𝗹𝗲𝘁𝗶𝗼𝗻.
🔹 𝗪𝗮𝘃𝗲𝘀 𝗔, 𝗕 𝗮𝗻𝗱 𝗖 are identified on the accompanying chart.
🔹 My analysis also identifies 𝗳𝗶𝘃𝗲 𝗶𝗻𝘁𝗲𝗿𝗻𝗮𝗹 𝘀𝘂𝗯𝘄𝗮𝘃𝗲𝘀 𝘄𝗶𝘁𝗵𝗶𝗻 𝗪𝗮𝘃𝗲 𝗖, consistent with a completed corrective impulse.
🔹 The final 𝗰𝗮𝗽𝗶𝘁𝘂𝗹𝗮𝘁𝗶𝗼𝗻 𝗰𝗮𝗻𝗱𝗹𝗲, highlighted in yellow, produced an exhaustion selloff that was subsequently absorbed by buyers.
🎯 𝗪𝗛𝗔𝗧 𝗖𝗢𝗠𝗘𝗦 𝗡𝗘𝗫𝗧?
$BTC is now showing the early formation of a 𝗩-𝗦𝗛𝗔𝗣𝗘𝗗 𝗥𝗘𝗩𝗘𝗥𝗦𝗔𝗟, suggesting that the corrective low may be behind us. See picture.
🚀 𝗙𝗜𝗥𝗦𝗧 𝗨𝗣𝗦𝗜𝗗𝗘 𝗧𝗔𝗥𝗚𝗘𝗧: $78,680
A sustained recovery toward this level would strengthen the bullish reversal thesis.
🎥 𝗘𝗫𝗖𝗟𝗨𝗦𝗜𝗩𝗘 𝗠𝗘𝗠𝗕𝗘𝗥𝗦 𝗔𝗡𝗔𝗟𝗬𝗦𝗜𝗦
Tonight, I provided members with a detailed video breakdown of all five internal subwaves of Wave C, including the evidence supporting corrective exhaustion and the anticipated reversal.
𝗧𝗵𝗲 𝗰𝗼𝗿𝗿𝗲𝗰𝘁𝗶𝗼𝗻 𝗮𝗽𝗽𝗲𝗮𝗿𝘀 𝗰𝗼𝗺𝗽𝗹𝗲𝘁𝗲. 𝗧𝗵𝗲 𝗿𝗲𝗰𝗼𝘃𝗲𝗿𝘆 𝗺𝗮𝘆 𝗯𝗲 𝗷𝘂𝘀𝘁 𝗯𝗲𝗴𝗶𝗻𝗻𝗶𝗻𝗴. Tomorrow's MOON is the KEY marker. Subscribe to find out about the next higher levels on BTC.
Share & Subscribe, <link in bio>.
$SPY $QQQ $IWM $MDY $RUT $DIA $SDOW $SOXX $SOXS $SMH $NVDA $TSLA $YINN $VIX $VXX $TLT $BTC $GLD $SLV $SVXY $DRAM $SNDK $MU $EWJ $EWY

🌑🌱 𝗡𝗘𝗪 𝗠𝗢𝗢𝗡 — 𝗠𝗢𝗡𝗗𝗔𝗬, 𝟭𝟭/𝟬𝟵/𝟮𝟲. 𝗚𝗥𝗘𝗘𝗡 𝗦𝗛𝗢𝗢𝗧𝗦. $NVDA
The New Moon arrives Monday, November 9, at a potentially pivotal moment for the markets.
🎯 𝗠𝗬 𝗙𝗢𝗥𝗘𝗖𝗔𝗦𝗧:
The iconic 𝗚𝗥𝗘𝗘𝗡 of the NVIDIA logo may very well match the color of $SPY's closing candle tomorrow.
With corrective 𝗪𝗮𝘃𝗲 𝗖 potentially nearing exhaustion and major long-term technical support being tested, the setup favors the emergence of 𝗚𝗥𝗘𝗘𝗡 𝗦𝗛𝗢𝗢𝗧𝗦 𝗜𝗡𝗧𝗢 𝗧𝗛𝗘 𝗖𝗟𝗢𝗦𝗘.
⚠️ 𝗧𝗛𝗘 𝗡𝗘𝗚𝗔𝗧𝗜𝗩𝗘 𝗡𝗘𝗪𝗦 — 𝗧𝗪𝗢 𝗣𝗢𝗦𝗦𝗜𝗕𝗟𝗘 𝗢𝗨𝗧𝗖𝗢𝗠𝗘𝗦:
🔹 𝗖𝗔𝗣𝗜𝗧𝗨𝗟𝗔𝗧𝗜𝗢𝗡: The headlines trigger a final wave of panic selling, flushing out weak hands into major technical support.
🔹 𝗕𝗨𝗟𝗟𝗜𝗦𝗛 𝗧𝗛𝗥𝗨𝗦𝗧: The market recognizes that the controversy may ultimately prove to be a personal ordeal rather than a material threat to NVIDIA's underlying business. An unexpectedly limited business impact could fuel a sharp reversal as fear unwinds.
𝗧𝗵𝗲 𝗸𝗲𝘆 𝗶𝘀 𝗻𝗼𝘁 𝗺𝗲𝗿𝗲𝗹𝘆 𝘁𝗵𝗲 𝗻𝗲𝘄𝘀, 𝗯𝘂𝘁 𝗵𝗼𝘄 𝘁𝗵𝗲 𝗺𝗮𝗿𝗸𝗲𝘁 𝗿𝗲𝗮𝗰𝘁𝘀 𝘁𝗼 𝗶𝘁.
🌱 𝗡𝗘𝗪 𝗠𝗢𝗢𝗡. 𝗡𝗘𝗪 𝗖𝗬𝗖𝗟𝗘. 𝗣𝗢𝗧𝗘𝗡𝗧𝗜𝗔𝗟 𝗥𝗘𝗩𝗘𝗥𝗦𝗔𝗟.
Share & Subscribe, <link in bio>.
$SPY $QQQ $IWM $MDY $RUT $DIA $SDOW $SOXX $SOXS $SMH $NVDA $TSLA $YINN $VIX $VXX $TLT $BTC $GLD $SLV $SVXY $DRAM $SNDK $MU $EWJ $EWY
🚨🚨🚨 𝗦𝗛𝗢𝗨𝗟𝗗 𝗬𝗢𝗨 𝗦𝗘𝗟𝗟 $NVDA 𝗧𝗢𝗡𝗜𝗚𝗛𝗧?
📈 𝗔𝗜𝗤 — 𝗛𝗢𝗟𝗗𝗜𝗡𝗚 𝗟𝗢𝗡𝗚-𝗧𝗘𝗥𝗠 𝗦𝗨𝗣𝗣𝗢𝗥𝗧
November 8, 2026 | AI & Technology Index
𝗧𝗵𝗲 "𝘁𝗶𝗺𝗶𝗻𝗴" 𝗼𝗳 𝘁𝗵𝗲 $NVDA 𝗻𝗲𝘄𝘀 𝗺𝗮𝘆 𝗯𝗲 𝗺𝗼𝗿𝗲 𝘀𝗶𝗴𝗻𝗶𝗳𝗶𝗰𝗮𝗻𝘁 𝘁𝗵𝗮𝗻 𝘁𝗵𝗲 𝗻𝗲𝘄𝘀 𝗶𝘁𝘀𝗲𝗹𝗳.
Consider this remarkable confluence of events:
🔹 𝟭. 𝗡𝗘𝗪 𝗠𝗢𝗢𝗡 — 𝗡𝗢𝗩𝗘𝗠𝗕𝗘𝗥 𝟵
Tomorrow marks a New Moon, an astronomical event I monitor as a potential timing window for a market reversal.
🔹 𝟮. 𝗧𝗛𝗘 𝗧𝗔𝗜𝗟 𝗘𝗡𝗗 𝗢𝗙 𝗪𝗔𝗩𝗘 𝗖
The news emerges precisely as corrective Wave C appears to be approaching exhaustion.
Not two weeks ago. Not after earnings. But this weekend, at a critical technical and timing juncture.
🔹 𝟯. $NVDA 𝗘𝗔𝗥𝗡𝗜𝗡𝗚𝗦 𝗔𝗣𝗣𝗥𝗢𝗔𝗖𝗛𝗜𝗡𝗚
The headlines arrive roughly a week ahead of anticipated NVIDIA earnings, when investor sensitivity is already elevated.
🎯 𝗧𝗛𝗘 𝗕𝗜𝗚𝗚𝗘𝗥 𝗣𝗜𝗖𝗧𝗨𝗥𝗘
Is this timing merely coincidental, or does the narrative amplify fear precisely when weak hands are most vulnerable?
The attached $AIQ chart shows price testing its 𝗹𝗼𝗻𝗴-𝘁𝗲𝗿𝗺 𝗮𝘀𝗰𝗲𝗻𝗱𝗶𝗻𝗴 𝘀𝘂𝗽𝗽𝗼𝗿𝘁 for the third time.
My interpretation is that the immediate pressure is directed less at @JensenHuang personally and more at 𝗶𝗻𝘃𝗲𝘀𝘁𝗼𝗿 𝗰𝗼𝗻𝗳𝗶𝗱𝗲𝗻𝗰𝗲.
𝗧𝗛𝗘 𝗣𝗢𝗧𝗘𝗡𝗧𝗜𝗔𝗟 𝗢𝗨𝗧𝗖𝗢𝗠𝗘?
Shareholders surrendering their $NVDA positions into major technical support, just as the corrective cycle may be nearing completion.
This timing deserves scrutiny!
⚠️ 𝗪𝗔𝗧𝗖𝗛 𝗧𝗛𝗘 𝗦𝗨𝗣𝗣𝗢𝗥𝗧.
𝗪𝗔𝗧𝗖𝗛 𝗧𝗛𝗘 𝗧𝗜𝗠𝗜𝗡𝗚.
𝗪𝗔𝗧𝗖𝗛 𝗧𝗛𝗘 𝗥𝗘𝗔𝗖𝗧𝗜𝗢𝗡.
$182 $NVDA is a Fortress price area. $AIQ agrees for now.
Share & Subscribe, <link in bio>.
$SPY $QQQ $IWM $MDY $RUT $DIA $SDOW $SOXX $SOXS $SMH $NVDA $TSLA $YINN $VIX $VXX $TLT $BTC $GLD $SLV $SVXY $DRAM $SNDK $MU $EWJ $EWY
🚨🚨🚨 𝗘𝗦 𝗙𝗨𝗧𝗨𝗥𝗘𝗦 — 𝗧𝗛𝗘 𝗟𝗢𝗡𝗚-𝗧𝗘𝗥𝗠 𝗕𝗨𝗟𝗟𝗜𝗦𝗛 𝗧𝗥𝗘𝗡𝗗 𝗜𝗦 𝗜𝗡𝗧𝗔𝗖𝗧!
📅 November 7, 2026
📈 𝗧𝗛𝗥𝗘𝗘 𝗣𝗢𝗜𝗡𝗧𝗦. 𝗢𝗡𝗘 𝗕𝗨𝗟𝗟𝗜𝗦𝗛 𝗧𝗥𝗘𝗡𝗗.
The $ES weekly chart continues to respect its long-term ascending support line connecting the April 2025 Liberation Day bottom, March 2026 corrective low, and November 2026 retest.
Unlike the recent structural weakness in $SPY, futures are still defending this critical bullish trendline. See chart.
⚡ 𝗠𝗢𝗡𝗗𝗔𝗬'𝗦 𝗩𝗢𝗟𝗔𝗧𝗜𝗟𝗜𝗧𝗬 𝗦𝗘𝗧𝗨𝗣
#VIX1D closed Friday elevated, creating the potential for a sharp volatility crush Monday morning and a stronger $SPY opening at 9:30 AM EST.
🔥 𝗧𝗛𝗘 𝗦𝗤𝗨𝗘𝗘𝗭𝗘 𝗦𝗘𝗧𝗨𝗣
@fundstrat's bullish outlook is warranted, in my view.
Even if Monday delivers a final mini flash crash to clear remaining liquidity, the deeply depressed 𝗦𝗤𝗨𝗘𝗘𝗭𝗘 𝗜𝗡𝗗𝗘𝗫 favors a powerful mean-reversion rally once selling pressure exhausts itself.
🎯 𝗠𝗬 𝗕𝗔𝗦𝗘 𝗖𝗔𝗦𝗘: An upside squeeze, potentially preceded by one final downside liquidity sweep.
A sustained loss of the rising support line would challenge this outlook.
𝗧𝗛𝗘 𝗦𝗤𝗨𝗘𝗘𝗭𝗘 𝗜𝗦 𝗠𝗬 𝗣𝗥𝗘𝗙𝗘𝗥𝗥𝗘𝗗 𝗦𝗖𝗘𝗡𝗔𝗥𝗜𝗢.
Share & Subscribe, <<link in bio>>.
$SPY $QQQ $IWM $MDY $RUT $DIA $SDOW $SOXX $SOXS $SMH $NVDA $TSLA $YINN $VIX $VXX $TLT $BTC $GLD $SLV $SVXY
Astro Zan retweeted
𝗡𝗩𝗗𝗔 𝗕𝗔𝗖𝗞 𝗔𝗧 𝗧𝗛𝗘 𝗪𝗘𝗘𝗞𝗟𝗬 𝗣𝗢𝗖 — 𝗠𝗔𝗦𝗦𝗜𝗩𝗘 𝗟𝗜𝗤𝗨𝗜𝗗𝗜𝗧𝗬 𝗔𝗧 $𝟭𝟴𝟮
11/05/26
🔹 𝗧𝗵𝗲 $𝟭𝟴𝟮 𝗟𝗶𝗾𝘂𝗶𝗱𝗶𝘁𝘆 𝗠𝗮𝗴𝗻𝗲𝘁
$NVDA has returned to its weekly Point of Control (POC), near $182 — the price center where the largest concentration of historical trading volume has accumulated.
🔹 𝗡𝗶𝗻𝗲 𝗠𝗼𝗻𝘁𝗵𝘀 𝗼𝗳 𝗟𝗶𝗾𝘂𝗶𝗱𝗶𝘁𝘆
For approximately nine months, substantial trading activity has built around this same $182 price center. See the blue horizontal line and the original consolidation zone highlighted in red.
🔹 𝗔 𝗚𝗿𝗮𝗯-𝗮𝗻𝗱-𝗚𝗼 𝗢𝗽𝗽𝗼𝗿𝘁𝘂𝗻𝗶𝘁𝘆?
Even if $NVDA briefly breaks below $182 for a session, this high-volume price center remains a powerful potential magnet.
A temporary liquidity sweep below the level, followed by a rapid reclaim, could create the ideal grab-and-go setup for the next bullish advance.
🔹 𝗩𝗼𝗹𝗮𝘁𝗶𝗹𝗶𝘁𝘆 𝗜𝘀 𝗦𝗵𝗼𝘄𝗶𝗻𝗴 𝗦𝗶𝗴𝗻𝘀 𝗼𝗳 𝗕𝗮𝘀𝗶𝗻𝗴
As of 2:00 PM ET, $SVIX and the broader volatility complex were showing signs of stabilization.
𝗠𝘆 𝗣𝗹𝗮𝗻: I will be accumulating long-term $NVDA positions around these levels between now and Monday.
𝗧𝗵𝗲 𝗕𝗼𝘁𝘁𝗼𝗺 𝗟𝗶𝗻𝗲: $182 is not just another price level. It represents nine months of accumulated trading activity — a major battleground where buyers and sellers may establish the next directional move.
$NVDA $SOXX $SOXL $SMH $SPY $QQQ $SVIX $VIX

$SOXL: 100% Brutal Retracement with WAVE C of the entire move from Liberation Day 3/30 until today.
Our chart captured the essence of Wave A , B , and C, as shown. But I didn't believe they would retrace to 100% in 10 days. I was expecting one reversal higher before the final move. That didn't happen. It was merciless!
$40 to $300 to $40.
They will give you the handle. See pic.
Share & Subscribe, <<link in bio>>.
$SPY $QQQ $IWM $MDY $RUT $DIA $SDOW $SOXX $SOXS $SMH $NVDA $TSLA $YINN $VIX $VXX $TLT $BTC $GLD $SLV $SVXY

⚠️⚠️⚠️ $SPY— 𝗧𝗛𝗘 𝗪𝗘𝗘𝗞𝗟𝗬 𝗖𝗛𝗔𝗥𝗧 𝗛𝗔𝗦 𝗟𝗢𝗦𝗧 𝗠𝗬 𝗧𝗥𝗨𝗦𝗧
𝗡𝗼𝘃𝗲𝗺𝗯𝗲𝗿 𝟱, 𝟮𝟬𝟮𝟲 | 𝗔 𝗠𝗮𝗷𝗼𝗿 𝗦𝘁𝗿𝘂𝗰𝘁𝘂𝗿𝗮𝗹 𝗪𝗮𝗿𝗻𝗶𝗻𝗴
The long-term bullish case for $SPY is now 𝗦𝗨𝗦𝗣𝗘𝗖𝗧.
For the first time, the market has breached a major rising support line connecting two critical lows in this bull market.
📐 𝗧𝗛𝗘 𝗠𝗔𝗧𝗛𝗘𝗠𝗔𝗧𝗜𝗖𝗦 𝗢𝗙 𝗧𝗛𝗘 𝗕𝗥𝗘𝗔𝗞𝗗𝗢𝗪𝗡
Using the geometric support line anchored to:
🔹 𝗣𝗼𝗶𝗻𝘁 𝟭: April 7, 2025 — Liberation Day low at $481.80, and passing through:
🔹 𝗣𝗼𝗶𝗻𝘁 𝟮: March 30, 2026 — Major corrective low at $629.28
🔹 𝗣𝗼𝗶𝗻𝘁 𝟯: November 5, 2026 — Calculated support at 𝗦𝟳𝟰𝟭.𝟴𝟱
Today, $SPY traded below that calculated support, reaching approximately $731 this hour.
🚨 𝗧𝗛𝗘 𝗗𝗔𝗠𝗔𝗚𝗘 𝗜𝗦 𝗗𝗢𝗡𝗘.
This is not merely about losing $742. It is about 𝗹𝗼𝘀𝗶𝗻𝗴 𝗰𝗼𝗻𝗳𝗶𝗱𝗲𝗻𝗰𝗲 𝗶𝗻 𝘁𝗵𝗲 𝘀𝘁𝗿𝘂𝗰𝘁𝘂𝗿𝗮𝗹 𝗶𝗻𝘁𝗲𝗴𝗿𝗶𝘁𝘆 of the entire rising trend.
For months, this support line served as the mathematical foundation of the bullish case. Every major correction had a reference point. Every selloff could be evaluated against an established rising floor.
𝗧𝗵𝗮𝘁 𝗳𝗹𝗼𝗼𝗿 𝗵𝗮𝘀 𝗻𝗼𝘄 𝗯𝗲𝗲𝗻 𝗯𝗿𝗲𝗮𝗰𝗵𝗲𝗱.
And even if $SPY recovers above $742 tomorrow, the original confidence in that support cannot simply be restored.
A broken support line is no longer an unquestionable foundation. 𝗧𝗵𝗲 𝗺𝗮𝗿𝗸𝗲𝘁 𝗺𝘂𝘀𝘁 𝗲𝗮𝗿𝗻 𝘁𝗵𝗮𝘁 𝘁𝗿𝘂𝘀𝘁 𝗮𝗴𝗮𝗶𝗻, 𝗳𝗿𝗼𝗺 𝘀𝗰𝗿𝗮𝘁𝗰𝗵.
📉 𝗪𝗛𝗔𝗧 𝗖𝗛𝗔𝗡𝗚𝗘𝗦 𝗙𝗥𝗢𝗠 𝗛𝗘𝗥𝗘?
My approach to future rallies must now change.
Previously, corrections toward major support represented potential buying opportunities within an intact bullish structure.
Now, rallies may need to be treated as 𝗦𝗘𝗟𝗟𝗜𝗡𝗚 𝗢𝗣𝗣𝗢𝗥𝗧𝗨𝗡𝗜𝗧𝗜𝗘𝗦 until the market proves otherwise.
Even a substantial recovery above the broken support line would not eliminate the possibility of another decline toward lower lows.
𝗧𝗵𝗮𝘁 𝗶𝘀 𝘁𝗵𝗲 𝗰𝗿𝗶𝘁𝗶𝗰𝗮𝗹 𝗱𝗶𝘀𝘁𝗶𝗻𝗰𝘁𝗶𝗼𝗻.
𝗔 𝗿𝗮𝗹𝗹𝘆 𝗶𝘀 𝗻𝗼𝘁 𝗻𝗲𝗰𝗲𝘀𝘀𝗮𝗿𝗶𝗹𝘆 𝗮 𝗿𝗲𝘀𝘁𝗼𝗿𝗮𝘁𝗶𝗼𝗻 𝗼𝗳 𝘁𝗵𝗲 𝗯𝘂𝗹𝗹 𝗺𝗮𝗿𝗸𝗲𝘁.
The market can rally, reclaim resistance, attract buyers, and still return later to establish a lower low.
⚠️ 𝗧𝗛𝗘 𝗡𝗘𝗪 𝗥𝗨𝗟𝗘: 𝗧𝗥𝗨𝗦𝗧 𝗠𝗨𝗦𝗧 𝗕𝗘 𝗥𝗘𝗕𝗨𝗜𝗟𝗧.
I am not declaring that every rally will fail, nor that a bear market is guaranteed.
I am declaring that 𝘁𝗵𝗲 𝗼𝗿𝗶𝗴𝗶𝗻𝗮𝗹 𝗯𝘂𝗹𝗹𝗶𝘀𝗵 𝗳𝗿𝗮𝗺𝗲𝘄𝗼𝗿𝗸 𝗵𝗮𝘀 𝗯𝗲𝗲𝗻 𝗰𝗼𝗺𝗽𝗿𝗼𝗺𝗶𝘀𝗲𝗱.
𝗧𝗵𝗲 𝗯𝘂𝗿𝗱𝗲𝗻 𝗼𝗳 𝗽𝗿𝗼𝗼𝗳 𝗵𝗮𝘀 𝘀𝗵𝗶𝗳𝘁𝗲𝗱 𝘁𝗼 𝘁𝗵𝗲 𝗯𝘂𝗹𝗹𝘀.
Until $SPY establishes a credible new support structure, I will treat future upside with greater skepticism and remain open to selling rallies rather than automatically buying corrections.
𝗧𝗵𝗲 𝗼𝗹𝗱 𝘀𝘂𝗽𝗽𝗼𝗿𝘁 𝗹𝗶𝗻𝗲 𝘄𝗮𝘀 𝗼𝘂𝗿 𝗳𝗼𝘂𝗻𝗱𝗮𝘁𝗶𝗼𝗻. 𝗧𝗼𝗱𝗮𝘆, 𝘁𝗵𝗮𝘁 𝗳𝗼𝘂𝗻𝗱𝗮𝘁𝗶𝗼𝗻 𝗰𝗿𝗮𝗰𝗸𝗲𝗱.
𝗔𝗻𝗱 𝗮 𝗺𝗮𝗿𝗸𝗲𝘁 𝘁𝗵𝗮𝘁 𝗯𝗿𝗲𝗮𝗸𝘀 𝗶𝘁𝘀 𝗳𝗼𝘂𝗻𝗱𝗮𝘁𝗶𝗼𝗻 𝗺𝘂𝘀𝘁 𝗽𝗿𝗼𝘃𝗲 𝗶𝘁 𝗰𝗮𝗻 𝘀𝘁𝗮𝗻𝗱 𝗮𝗴𝗮𝗶𝗻.
𝗦𝗵𝗮𝗿𝗲 & 𝗦𝘂𝗯𝘀𝗰𝗿𝗶𝗯𝗲, <<link in bio>>.
$SPY $QQQ $IWM $MDY $RUT $DIA $SDOW $SOXX $SOXS $SMH $NVDA $TSLA $YINN $VIX $VXX $TLT $BTC $GLD $SLV $SVXY

𝗡𝗩𝗗𝗔 𝗕𝗔𝗖𝗞 𝗔𝗧 𝗧𝗛𝗘 𝗪𝗘𝗘𝗞𝗟𝗬 𝗣𝗢𝗖 — 𝗠𝗔𝗦𝗦𝗜𝗩𝗘 𝗟𝗜𝗤𝗨𝗜𝗗𝗜𝗧𝗬 𝗔𝗧 $𝟭𝟴𝟮
11/05/26
🔹 𝗧𝗵𝗲 $𝟭𝟴𝟮 𝗟𝗶𝗾𝘂𝗶𝗱𝗶𝘁𝘆 𝗠𝗮𝗴𝗻𝗲𝘁
$NVDA has returned to its weekly Point of Control (POC), near $182 — the price center where the largest concentration of historical trading volume has accumulated.
🔹 𝗡𝗶𝗻𝗲 𝗠𝗼𝗻𝘁𝗵𝘀 𝗼𝗳 𝗟𝗶𝗾𝘂𝗶𝗱𝗶𝘁𝘆
For approximately nine months, substantial trading activity has built around this same $182 price center. See the blue horizontal line and the original consolidation zone highlighted in red.
🔹 𝗔 𝗚𝗿𝗮𝗯-𝗮𝗻𝗱-𝗚𝗼 𝗢𝗽𝗽𝗼𝗿𝘁𝘂𝗻𝗶𝘁𝘆?
Even if $NVDA briefly breaks below $182 for a session, this high-volume price center remains a powerful potential magnet.
A temporary liquidity sweep below the level, followed by a rapid reclaim, could create the ideal grab-and-go setup for the next bullish advance.
🔹 𝗩𝗼𝗹𝗮𝘁𝗶𝗹𝗶𝘁𝘆 𝗜𝘀 𝗦𝗵𝗼𝘄𝗶𝗻𝗴 𝗦𝗶𝗴𝗻𝘀 𝗼𝗳 𝗕𝗮𝘀𝗶𝗻𝗴
As of 2:00 PM ET, $SVIX and the broader volatility complex were showing signs of stabilization.
𝗠𝘆 𝗣𝗹𝗮𝗻: I will be accumulating long-term $NVDA positions around these levels between now and Monday.
𝗧𝗵𝗲 𝗕𝗼𝘁𝘁𝗼𝗺 𝗟𝗶𝗻𝗲: $182 is not just another price level. It represents nine months of accumulated trading activity — a major battleground where buyers and sellers may establish the next directional move.
$NVDA $SOXX $SOXL $SMH $SPY $QQQ $SVIX $VIX

⚠️⚠️ $SPY Remember if this capitulates here at support, SPY can close with GREEN candle on the day. See previous instance, lower red circle, against the same support line. See pic.

$SPY Monthly Chart Remains Bullish Above $743. 11/05/26
This is the target for reversal during the cash session today.
See pic.
Share & Subscribe, <<link in bio>>.
$SPY $QQQ $IWM $MDY $RUT $DIA $SDOW $SOXX $SOXS $SMH $NVDA $TSLA $YINN $VIX $VXX $TLT $BTC $GLD $SLV $SVXY

🚨 𝗦𝗣𝗬 $𝟳𝟰𝟯 — 𝗧𝗵𝗲 𝗖𝗮𝘀𝗵 𝗦𝗲𝘀𝘀𝗶𝗼𝗻 𝗛𝗮𝘀 𝗨𝗻𝗳𝗶𝗻𝗶𝘀𝗵𝗲𝗱 𝗕𝘂𝘀𝗶𝗻𝗲𝘀𝘀!
11/05/26
• Yesterday, $SPY reached the critical $743/$744 level in premarket trading, 𝗯𝘂𝘁 𝘁𝗵𝗲 𝗿𝗲𝗴𝘂𝗹𝗮𝗿 𝗰𝗮𝘀𝗵 𝘀𝗲𝘀𝘀𝗶𝗼𝗻 𝗻𝗲𝘃𝗲𝗿 𝘁𝗼𝘂𝗰𝗵𝗲𝗱 𝗶𝘁.
• I believe $SPY is very likely to revisit $743/$744 𝗲𝗶𝘁𝗵𝗲𝗿 𝘁𝗼𝗱𝗮𝘆 𝗼𝗿 𝘁𝗼𝗺𝗼𝗿𝗿𝗼𝘄, potentially delivering the final capitulation event.
• 𝗧𝗵𝗲 𝗰𝗮𝘀𝗵 𝘀𝗲𝘀𝘀𝗶𝗼𝗻 𝗻𝗲𝗲𝗱𝘀 𝘁𝗼 𝘀𝗲𝗲 $𝟳𝟰𝟯. The premarket test alone may not be sufficient to complete the corrective structure.
• 𝗪𝗵𝘆 $𝟳𝟰𝟯 𝗺𝗮𝘁𝘁𝗲𝗿𝘀: This level represents a critical support zone capable of preserving the 𝗹𝗼𝗻𝗴-𝘁𝗲𝗿𝗺 𝗯𝘂𝗹𝗹𝗶𝘀𝗵 𝘁𝗿𝗲𝗻𝗱 despite the severity of the current correction. This structure comes from the monthly bullish chart.
📉 𝗠𝘆 𝗣𝗿𝗲𝗳𝗲𝗿𝗿𝗲𝗱 𝗦𝗰𝗲𝗻𝗮𝗿𝗶𝗼: One final flush toward $743, capitulation, and a reversal that leaves the broader bullish structure intact.
⚠️ A sustained breakdown below $743 would weaken this scenario and warrant reassessment.
𝗧𝗵𝗲 𝗯𝘂𝗹𝗹 𝗺𝗮𝗿𝗸𝗲𝘁 𝗱𝗼𝗲𝘀𝗻'𝘁 𝗻𝗲𝗲𝗱 𝗮 𝗽𝗮𝗶𝗻𝗹𝗲𝘀𝘀 𝗰𝗼𝗿𝗿𝗲𝗰𝘁𝗶𝗼𝗻. 𝗜𝘁 𝗻𝗲𝗲𝗱𝘀 𝗶𝘁𝘀 𝗹𝗼𝗻𝗴-𝘁𝗲𝗿𝗺 𝘀𝘂𝗽𝗽𝗼𝗿𝘁 𝘁𝗼 𝗵𝗼𝗹𝗱.
Share & Subscribe, <<link in bio>>.
$SPY $QQQ $IWM $MDY $RUT $DIA $SDOW $SOXX $SOXS $SMH $NVDA $TSLA $YINN $VIX $VXX $TLT $BTC $GLD $SLV $SVXY

🚨 𝗦𝗣𝗬 $𝟳𝟰𝟯 — 𝗧𝗵𝗲 𝗖𝗮𝘀𝗵 𝗦𝗲𝘀𝘀𝗶𝗼𝗻 𝗛𝗮𝘀 𝗨𝗻𝗳𝗶𝗻𝗶𝘀𝗵𝗲𝗱 𝗕𝘂𝘀𝗶𝗻𝗲𝘀𝘀!
11/05/26
• Yesterday, $SPY reached the critical $743/$744 level in premarket trading, 𝗯𝘂𝘁 𝘁𝗵𝗲 𝗿𝗲𝗴𝘂𝗹𝗮𝗿 𝗰𝗮𝘀𝗵 𝘀𝗲𝘀𝘀𝗶𝗼𝗻 𝗻𝗲𝘃𝗲𝗿 𝘁𝗼𝘂𝗰𝗵𝗲𝗱 𝗶𝘁.
• I believe $SPY is very likely to revisit $743/$744 𝗲𝗶𝘁𝗵𝗲𝗿 𝘁𝗼𝗱𝗮𝘆 𝗼𝗿 𝘁𝗼𝗺𝗼𝗿𝗿𝗼𝘄, potentially delivering the final capitulation event.
• 𝗧𝗵𝗲 𝗰𝗮𝘀𝗵 𝘀𝗲𝘀𝘀𝗶𝗼𝗻 𝗻𝗲𝗲𝗱𝘀 𝘁𝗼 𝘀𝗲𝗲 $𝟳𝟰𝟯. The premarket test alone may not be sufficient to complete the corrective structure.
• 𝗪𝗵𝘆 $𝟳𝟰𝟯 𝗺𝗮𝘁𝘁𝗲𝗿𝘀: This level represents a critical support zone capable of preserving the 𝗹𝗼𝗻𝗴-𝘁𝗲𝗿𝗺 𝗯𝘂𝗹𝗹𝗶𝘀𝗵 𝘁𝗿𝗲𝗻𝗱 despite the severity of the current correction. This structure comes from the monthly bullish chart.
📉 𝗠𝘆 𝗣𝗿𝗲𝗳𝗲𝗿𝗿𝗲𝗱 𝗦𝗰𝗲𝗻𝗮𝗿𝗶𝗼: One final flush toward $743, capitulation, and a reversal that leaves the broader bullish structure intact.
⚠️ A sustained breakdown below $743 would weaken this scenario and warrant reassessment.
𝗧𝗵𝗲 𝗯𝘂𝗹𝗹 𝗺𝗮𝗿𝗸𝗲𝘁 𝗱𝗼𝗲𝘀𝗻'𝘁 𝗻𝗲𝗲𝗱 𝗮 𝗽𝗮𝗶𝗻𝗹𝗲𝘀𝘀 𝗰𝗼𝗿𝗿𝗲𝗰𝘁𝗶𝗼𝗻. 𝗜𝘁 𝗻𝗲𝗲𝗱𝘀 𝗶𝘁𝘀 𝗹𝗼𝗻𝗴-𝘁𝗲𝗿𝗺 𝘀𝘂𝗽𝗽𝗼𝗿𝘁 𝘁𝗼 𝗵𝗼𝗹𝗱.
Share & Subscribe, <<link in bio>>.
$SPY $QQQ $IWM $MDY $RUT $DIA $SDOW $SOXX $SOXS $SMH $NVDA $TSLA $YINN $VIX $VXX $TLT $BTC $GLD $SLV $SVXY
🚨🚨 𝗕𝗥𝗨𝗧𝗔𝗟 𝗘𝗫𝗧𝗘𝗡𝗦𝗜𝗢𝗡 𝗢𝗙 𝗪𝗔𝗩𝗘 𝗖 — $SOXL $SOXX
📉 𝗥𝗲𝗹𝗲𝗻𝘁𝗹𝗲𝘀𝘀. 𝗠𝗲𝗿𝗰𝗶𝗹𝗲𝘀𝘀.
• Chart updated with the 𝗺𝗼𝘀𝘁 𝗮𝗴𝗴𝗿𝗲𝘀𝘀𝗶𝘃𝗲 𝗱𝗲𝘀𝗰𝗲𝗻𝗱𝗶𝗻𝗴 𝗮𝗻𝗴𝗹𝗲. See the three red circles tracing the acceleration of the decline.
• This Wave C extension has 𝗳𝗮𝗿 𝗲𝘅𝗰𝗲𝗲𝗱 𝗺𝘆 𝗲𝘅𝗽𝗲𝗰𝘁𝗮𝘁𝗶𝗼𝗻𝘀. The selling pressure has been relentless, slicing through successive Fibonacci retracement levels.
• Today's price action has all the characteristics of 𝗰𝗮𝗽𝗶𝘁𝘂𝗹𝗮𝘁𝗶𝗼𝗻. We are witnessing the deepest and most aggressive phase of the correction: 𝗦𝘂𝗯𝘄𝗮𝘃𝗲 𝟱 𝗼𝗳 𝗪𝗮𝘃𝗲 𝗖.
• The 94.13% retracement has now come into focus, with the 100% retracement near $36 marking the ultimate downside reference on this chart.
⚠️ 𝗧𝗵𝗲 𝗣𝗮𝗿𝗮𝗱𝗼𝘅: The most violent selling often occurs near the terminal stage of a corrective wave. Capitulation can signal exhaustion, but confirmation of a reversal is still required.
📌 𝗪𝗮𝘁𝗰𝗵 𝘁𝗵𝗲 𝗳𝗶𝗻𝗮𝗹 𝗳𝗶𝗳𝘁𝗵 𝘀𝘂𝗯𝘄𝗮𝘃𝗲. The deeper the extension, the more consequential the potential reversal.
🔔 𝗦𝗵𝗮𝗿𝗲 & 𝗦𝘂𝗯𝘀𝗰𝗿𝗶𝗯𝗲 — Link in bio.
$SPY $QQQ $IWM $MDY $RUT $DIA $SDOW $SOXX $SOXS $SMH $NVDA $TSLA $YINN $VIX $VXX $TLT $BTC $GLD $SLV $SVXY

🚨 $SOXL — Brutal 90% Retracement From the ATH! | 11/04/26
Is Wave C Approaching Its Final Capitulation?
$SOXL has suffered a devastating decline, retracing nearly 90% of its advance from the original $39 base with the 3/30 ceasefire to the $301.94 all-time high.
But the geometry of this correction is revealing something important.
🔹 𝐖𝐚𝐯𝐞 𝐂 — 𝐓𝐡𝐞 𝐅𝐢𝐟𝐭𝐡 𝐒𝐮𝐛𝐰𝐚𝐯𝐞 𝐈𝐬 𝐈𝐧 𝐏𝐫𝐨𝐠𝐫𝐞𝐬𝐬
See the chart.
The descending line originating from the Wave A low extends directly into the projected termination zone of Wave C, where the fifth and final subwave is unfolding near $62.
This is no ordinary support line. It connects the geometry of Wave A to the potential exhaustion point of Wave C.
The yellow markers highlight the alignment.
🔹 𝐓𝐡𝐞 $𝟑𝟗 𝐐𝐮𝐞𝐬𝐭𝐢𝐨𝐧 — 𝐌𝐮𝐬𝐭 𝐖𝐚𝐯𝐞 𝟓 𝐑𝐞𝐭𝐫𝐚𝐜𝐞 𝐂𝐨𝐦𝐩𝐥𝐞𝐭𝐞𝐥𝐲?
Under a deeper Elliott Wave correction scenario, the entire advance could eventually be retraced to its origin near $39.07.
However, a complete retracement is not mandatory.
More importantly, my RSI observations indicate that $SOXL is now exhibiting conditions remarkably similar to those recorded at the Wave A bottom.
That similarity strengthens my conviction that a meaningful relief rally is imminent, potentially beginning around the current $62 region.
🔹 𝐅𝐢𝐫𝐬𝐭 𝐔𝐩𝐬𝐢𝐝𝐞 𝐓𝐚𝐫𝐠𝐞𝐭: $𝟖𝟔
The first major test is the descending resistance structure around $86, representing approximately 37% upside from $62.
This is where the market must reveal its hand.
𝐓𝐰𝐨 𝐒𝐜𝐞𝐧𝐚𝐫𝐢𝐨𝐬:
🟢 𝐁𝐮𝐥𝐥𝐢𝐬𝐡 𝐁𝐫𝐞𝐚𝐤𝐨𝐮𝐭: A decisive break above the descending resistance line would strengthen the case that Wave C and its fifth subwave have terminated. That opens the door to a much larger recovery, potentially toward new highs.
In this scenario, the bears pressing their shorts near the marked C bottom could find themselves trapped at precisely the wrong moment.
🔴 𝐑𝐞𝐣𝐞𝐜𝐭𝐢𝐨𝐧 𝐚𝐭 $𝟖𝟔: Failure to overcome resistance would leave the corrective structure unresolved, opening the possibility of another visit to $62, forming a double bottom, or a further decline toward the projected wedge apex near $54.50.
𝐌𝐲 𝐁𝐚𝐬𝐞 𝐂𝐚𝐬𝐞
The fifth subwave is still in progress, but the convergence of Wave A/C geometry, deep Fibonacci retracement, and matching RSI exhaustion conditions argues that $SOXL is approaching an important inflection point.
The 88.6% retracement at $69.04 has already been breached, bringing the 94.13% level at $54.50 into view as the next deeper Fibonacci reference.
I favor an imminent bounce toward $86 before the market decides whether this is the beginning of a major bullish reversal or merely an interruption in the final corrective decline.
$NVDA is showing a similar setup.
𝐓𝐡𝐞 𝐛𝐞𝐚𝐫𝐬 𝐦𝐚𝐲 𝐛𝐞 𝐫𝐮𝐧𝐧𝐢𝐧𝐠 𝐨𝐮𝐭 𝐨𝐟 𝐫𝐨𝐨𝐦 — 𝐚𝐧𝐝 𝐭𝐢𝐦𝐞.
Share & Subscribe, <link in bio>.
$SPY $QQQ $IWM $MDY $RUT $DIA $SDOW $SOXX $SOXS $SMH $NVDA $TSLA $YINN $VIX $VXX $TLT $BTC $GLD $SLV $SVXY $DRAM $SNDK $MU $EWJ $EWY

🚨 𝗖𝗔𝗧 𝗕𝗥𝗨𝗧𝗔𝗟 𝗖𝗢𝗥𝗥𝗘𝗖𝗧𝗜𝗢𝗡 — 𝗙𝗥𝗢𝗠 $𝟭,𝟭𝟬𝟬 𝗧𝗢 $𝟱𝟴𝟬! | 11/05/26
🔻 𝗡𝗲𝗮𝗿𝗹𝘆 𝟰𝟳% 𝗘𝗿𝗮𝘀𝗲𝗱. 𝗖𝗮𝗽𝗶𝘁𝘂𝗹𝗮𝘁𝗶𝗼𝗻 𝗼𝗿 𝗢𝗽𝗽𝗼𝗿𝘁𝘂𝗻𝗶𝘁𝘆?
• 𝗘𝘅𝘁𝗿𝗲𝗺𝗲 𝗢𝘃𝗲𝗿𝘀𝗼𝗹𝗱: I have never seen $CAT this oversold. The magnitude of this correction is extraordinary.
• 𝗖𝗮𝘂𝗴𝗵𝘁 𝗶𝗻 𝘁𝗵𝗲 $𝗦𝗢𝗫𝗫 𝗕𝘂𝗯𝗯𝗹𝗲 𝗕𝘂𝗿𝘀𝘁: $CAT has been swept into the semiconductor selloff, despite its industrial backbone and exposure to the AI data-center infrastructure build-out, particularly engines and power-generation equipment.
• 𝗪𝗮𝘁𝗰𝗵 𝗳𝗼𝗿 𝗮 𝗦𝘆𝗻𝗰𝗵𝗿𝗼𝗻𝗶𝘇𝗲𝗱 𝗕𝗼𝘁𝘁𝗼𝗺: I am watching for $CAT to establish a major bottom alongside $SOXX. Both may be approaching a shared inflection point.
• 𝗧𝗵𝗲 $𝗗𝗝𝗜 𝗗𝗶𝘃𝗲𝗿𝗴𝗲𝗻𝗰𝗲: Look at the attached Dow components. Green across the board among the leading heavyweights, except $CAT — the Dow's #2 component by weight, down everyday!
🎯 𝗠𝗬 𝗧𝗛𝗘𝗦𝗜𝗦: $CAT is becoming the conspicuous laggard in an otherwise resilient Dow. If $SOXX confirms its bottom, $CAT could be positioned for a powerful relief rally.
𝗧𝗵𝗲 𝗗𝗼𝘄 𝗶𝘀 𝘁𝗿𝘆𝗶𝗻𝗴 𝘁𝗼 𝗿𝗶𝘀𝗲 𝘄𝗶𝘁𝗵 𝗼𝗻𝗲 𝗼𝗳 𝗶𝘁𝘀 𝗵𝗲𝗮𝘃𝗶𝗲𝘀𝘁 𝗲𝗻𝗴𝗶𝗻𝗲𝘀 𝘀𝘁𝗶𝗹𝗹 𝗶𝗻 𝗿𝗲𝘃𝗲𝗿𝘀𝗲. 𝗪𝗮𝘁𝗰𝗵 𝘄𝗵𝗮𝘁 𝗵𝗮𝗽𝗽𝗲𝗻𝘀 𝘄𝗵𝗲𝗻 𝘁𝗵𝗮𝘁 𝗲𝗻𝗴𝗶𝗻𝗲 𝘁𝘂𝗿𝗻𝘀.
Share & Subscribe, <<link in bio>>.
$SPY $QQQ $IWM $MDY $RUT $DIA $SDOW $SOXX $SOXS $SMH $NVDA $TSLA $YINN $VIX $VXX $TLT $BTC $GLD $SLV $SVXY

Astro Zan retweeted
📈 𝗦𝗢𝗫𝗫 𝗣𝗿𝗶𝗰𝗲 𝗦𝗲𝘁𝘂𝗽 — 𝗜𝗻𝘃𝗲𝗿𝘀𝗲 𝗖𝘂𝗽 𝗖𝗼𝗺𝗽𝗹𝗲𝘁𝗲 | 𝟭𝟭/𝟬𝟰/𝟮𝟲
🔹 𝗧𝗵𝗲 𝗦𝘁𝗿𝘂𝗰𝘁𝘂𝗿𝗮𝗹 𝗖𝗮𝘀𝗲 𝗳𝗼𝗿 𝗮 𝗕𝘂𝗹𝗹𝗶𝘀𝗵 𝗥𝗲𝘃𝗲𝗿𝘀𝗮𝗹
Part of my bullish conviction in $NVDA comes directly from the broader structure of $SOXX.
• 𝗧𝗵𝗲 𝗜𝗻𝘃𝗲𝗿𝘀𝗲 𝗖𝘂𝗽 𝗜𝘀 𝗖𝗼𝗺𝗽𝗹𝗲𝘁𝗲. At approximately $450, SOXX has returned to the right rim of a massive inverse cup, precisely matching the left green-marked rim that launched the final bullish impulse toward the June peak, amid the $MU earnings saga.
• 𝗧𝗵𝗲 𝗢𝗿𝗶𝗴𝗶𝗻𝗮𝗹 𝗟𝗶𝗻𝗲𝗮𝗿 𝗧𝗿𝗲𝗻𝗱 𝗜𝘀 𝗦𝘁𝗶𝗹𝗹 𝗜𝗻𝘁𝗮𝗰𝘁. Today's $450 area intersects the rising gray support line originating in early 2026. The yellow markers illustrate repeated historical validations of this remarkably consistent linear trajectory. Today's retest adds another important touchpoint.
• 𝗙𝗿𝗼𝗺 𝗘𝘅𝗰𝗲𝘀𝘀 𝗕𝗮𝗰𝗸 𝘁𝗼 𝗟𝗶𝗻𝗲𝗮𝗿 𝗚𝗿𝗼𝘄𝘁𝗵. Even the bears should recognize the distinction: the recent correction may have simply removed the speculative froth represented by the cup, returning SOXX to its original, sustainable rising trajectory rather than signaling a structural breakdown.
• 𝗡𝗲𝘅𝘁 𝗦𝘁𝗼𝗽: 𝗧𝗵𝗲 𝗛𝗮𝗻𝗱𝗹𝗲. My preferred scenario calls for a recovery that develops a handle alongside the blue 50-day SMA, currently near $525.
⚠️ 𝗜𝗻𝘃𝗮𝗹𝗶𝗱𝗮𝘁𝗶𝗼𝗻: A decisive loss of the gray ascending support line, highlighted by the yellow markers, would invalidate this bullish interpretation.
I consider a material breakdown unlikely, particularly given the constructive price structure $NVDA is developing this week.
🎯 𝗕𝗼𝘁𝘁𝗼𝗺 𝗟𝗶𝗻𝗲: The cup has completed its journey. The excess has been removed. The original linear uptrend now has an opportunity to reclaim control.
Share & Subscribe, <link in bio>.
$SPY $QQQ $IWM $MDY $RUT $DIA $SDOW $SOXX $SOXS $SMH $NVDA $TSLA $YINN $VIX $VXX $TLT $BTC $GLD $SLV $SVXY $DRAM $SNDK $MU $EWJ $EWY
