

Do you like #DataVisualization and #Rstats? I tweet pretty plots created using pure base graphics without any dependencies. !Make base graphics great again! :)
Davanagere
Joined December 2020
- Tweets36
- Following6
- Followers365
- Likes6



Visualizing the cost of 1 GB of mobile data worldwide. Data visualised in #baseR
Source article: visualcapitalist.com/the-cos…
code: github.com/PoisonAlien/baseg…
#Rstats #DataVisualization

102


Visualizing MCU box-office performances. Data visualised in #baseR
Source article: visualcapitalist.com/charted…
code: github.com/PoisonAlien/baseg…
#Rstats #DataVisualization

3
346
Comparing the GDP of G7 and BRICS countries. Data visualised in #baseR
Source article: visualcapitalist.com/charted…
code: github.com/PoisonAlien/baseg…
#Rstats #DataVisualization

basegRaphics retweeted

Check out Isabel's #VizOfTheDay for effective survey data visualization, showcasing Likert Scales—a method to measure opinions through graded agreement-disagreement responses. tabsoft.co/3sQJtGe

Median Student Debt for a U.S. College Degree.
Data visualised in #baseR Source article: visualcapitalist.com/ranked-…
#RStats #Datavisualization
code: github.com/PoisonAlien/baseg…

Visualizing the World’s Top Gold Mining Stocks Performance in #baseR
Source article elements.visualcapitalist.co…
#RStats #Datavisualization
code: github.com/PoisonAlien/baseg…

3
334

Age group distribution in every state. Data visualised as Barcode chart in #baseR #RStats #Datavisualization code: github.com/PoisonAlien/baseg…

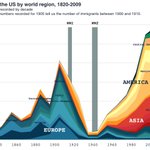
Latin America makes most of second wave US migration. Data visualised in #baseR.
#RStats #Datavisualization
code: github.com/PoisonAlien/baseg…

Where are Clean Energy Technologies Manufactured? Data visualised in #baseR
Recreated from the source article: elements.visualcapitalist.co…
#RStats #Datavisualization
code: github.com/PoisonAlien/baseg…

Who Americans Spend Their Time With?
Data visualised in #baseR
Source article: visualcapitalist.com/who-ame…
#RStats #Datavisualization
code: github.com/PoisonAlien/baseg…

Proportion of women in parliaments - visualised as an arrow plot in #baseR
#RStats #Datavisualization

Visualising the dynamics of global brands from 2000-2019.
#baseR #RStats #Datavisualization
github.com/PoisonAlien/baseg…
2022 Berlin marathon set the new record for fastest marathon finish by Eliud Kipchoge. Here is STRAVA inspired Berlin marathon finish times plotted in #baseR
Source article: strava.app.link/8Z4DsNq5Ftb
#RStats #Datavisualization
github.com/PoisonAlien/baseg…

1
4
Visualising dynamics of job trends in the next decade with #baseR
Source article: visualcapitalist.com/the-20-…
#RStats #Datavisualization
github.com/PoisonAlien/baseg…

There are several ways to delete columns in #rstats
One of them is by assigning NULL

Visualising blood group distribution in selected countries.
#RStats #Datavisualization
github.com/PoisonAlien/baseg…

basegRaphics retweeted

Today's #rstats cheatsheet: base-r
Download: raw.githubusercontent.com/rs…
See more: rstudio.com/resources/cheats…
Contribute your own: github.com/rstudio/cheatshee…

basegRaphics retweeted

📊Rを使った美しい作図を紹介するプロジェクト。ggplot2やlatticeを使わずに標準の作図機能でやるのがすごい。
ggplot2とは違った綺麗さがあるなと感じます。自分もこのくらいできるようになりたいな〜

Do you like #Rstats and #Datavisualization? Follow @baseRgraphics where I tweet pretty plots (with code and data) generated using pure base graphics with no dependencies.
This is for those who like to learn and customize base R plotting functions. #BaseisBeautiful :)


