
📊 Stock Trader & Market Analyst 📈 Daily Technical Analysis 📰 U.S. Market News & Watchlists 🚀 AI • Tech • Growth Stocks ⚠️ Not Financial Advice
Home Sweet Home
Joined June 2009
- Tweets336
- Following57
- Followers6.4K
- Likes136

📈 US Stock Market Morning News
October 8
🔥 1. Bond Yields Stay at Multi-Year Highs
Treasury yields remain elevated, keeping pressure on rate-sensitive sectors and market valuations.
🤖 2. AI Stocks Remain in Focus
Investors continue watching AI leaders as data center spending and chip demand dominate the market narrative.
🛢️ 3. Oil Prices Jump
Crude oil climbs on renewed geopolitical tensions, raising fresh concerns about inflation.
📅 4. Today's Focus
Markets are watching Fed officials, Treasury yields, and the start of another wave of corporate earnings.
💬 What's on your watchlist today?
#StockMarket #SP500 #NASDAQ #DowJones #Investing #Stocks
🚀 NVDA Technical Analysis
October 6
📈 Trend: Strong Bullish
🟢 Support: $235
🔴 Resistance: $250
My View:
NVDA remains one of the strongest leaders in the AI sector. As long as $235 holds, the uptrend remains intact. A decisive breakout above $250 could fuel another wave of momentum and attract more buyers.
👀 Bulls remain in control.
#NVDA #NVIDIA #AI #Stocks #TechnicalAnalysis #StockMarket
💊 LLY Technical Analysis
October 6
📈 Trend: Bullish
🟢 Support: $1,050
🔴 Resistance: $1,120
My View:
LLY continues to trade in a strong long-term uptrend. As long as $1,050 holds, buyers remain in control. A breakout above $1,120 could signal another leg higher, while losing support may lead to a healthy pullback before the next move.
👀 Staying bullish above support.
#LLY #EliLilly #Stocks #TechnicalAnalysis #StockMarket
🚀 SPCX Technical Analysis
October 6
📈 Trend: Bullish
🟢 Support: $160
🔴 Resistance: $175
My View:
SPCX remains in a strong uptrend after breaking to new post-IPO highs. As long as the price holds above $160, the bulls remain in control. A decisive breakout above $175 could trigger the next leg higher.
👀 Watching for volume confirmation.
#SPCX #SpaceX #Stocks #TechnicalAnalysis #StockMarket
📈 US Stock Market Morning News
October 6
🔥 1. Nasdaq Hits Another Record
AI stocks continue leading the market, with Nvidia extending its historic rally.
📊 2. Treasury Yields Stay Elevated
The 10-year Treasury yield remains above 5.3%, keeping pressure on rate-sensitive sectors.
💰 3. Stock Futures Edge Higher
S&P 500 and Dow futures point to another positive open as investors stay bullish on AI.
🗓️ 4. Market Focus Today
Investors are watching Treasury auctions, Fed speakers, and upcoming earnings for the next market catalyst.
👇 What's on your watchlist today?
#StockMarket #NASDAQ #SP500 #DowJones #NVDA #Investing
🚀 SPCX Technical Analysis | Oct 5
📈 Trend:
SPCX continues its short-term breakout after holding the $150 area.
🔹 Support: $150
🔹 Resistance: $170
My view:
As long as SPCX stays above the $150 support zone, the bullish momentum remains intact.
A clean breakout above $170 could open the door for further upside.
Watching closely. 🚀
#SPCX #SpaceX #StockMarket #TechnicalAnalysis
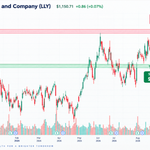
💊 $LLY Technical Analysis
📅 October 5, 2026
━━━━━━━━━━━━━━
💰 Current Price: ~$1,150
🟢 Support: $1,140
🔴 Resistance: $1,180
━━━━━━━━━━━━━━
📌 My View
LLY is still trading within a long-term uptrend, but the stock is currently consolidating after its recent rally.
As long as $1,140 holds, I remain bullish on the medium-term trend. A break above $1,180 could open the door for another move toward new highs. LLY continues to be supported by strong long-term fundamentals, even as price action pauses after its advance.
━━━━━━━━━━━━━━
🎯 Key Levels
🟢 Support: $1,140
🔴 Resistance: $1,180
━━━━━━━━━━━━━━
💡 Trading Plan
✅ Hold above $1,140 → Trend remains intact.
🚀 Break above $1,180 → Bullish breakout with upside momentum.
━━━━━━━━━━━━━━
I'm staying patient on $LLY. I'd rather add on pullbacks near support than chase strength into resistance.
$LLY #EliLilly #Healthcare #Stocks #TechnicalAnalysis #SwingTrading #Investing
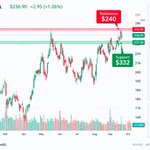
📈 $NVDA Technical Analysis
📅 October 5, 2026
━━━━━━━━━━━━━━
💰 Current Price: ~$237
🟢 Support: $232
🔴 Resistance: $240
━━━━━━━━━━━━━━
📌 My View
NVDA continues to trade in a strong bullish trend, holding above its key moving averages and hovering near a new all-time high. AI demand and positive market sentiment continue to support the stock.
As long as $232 holds, I remain bullish.
A decisive breakout above $240 could trigger another momentum leg higher and attract fresh buyers. Technical indicators remain constructive, although the stock is extended enough that chasing strength carries more risk than buying orderly pullbacks.
━━━━━━━━━━━━━━
🎯 Key Levels
🟢 Support: $232
🔴 Resistance: $240
━━━━━━━━━━━━━━
💡 Trading Plan
✅ Hold above $232 → Uptrend remains intact.
🚀 Break above $240 → Bullish breakout with potential for new highs.
━━━━━━━━━━━━━━
I'm staying bullish on $NVDA, but I'd rather buy healthy pullbacks than chase extended moves.
$NVDA #NVIDIA #AI #Stocks #StockMarket #TechnicalAnalysis #Trading #Investing

🇺🇸 Morning Market Brief
📅 October 5, 2026
📰 1. Tech Takes a Breather
After Friday's rally, U.S. futures are slightly lower as investors lock in profits. Nvidia remains near record highs, while chip stocks are mixed.
📊 2. Bond Yields Stay Elevated
The 10-year Treasury yield is holding around 5.3%. High yields remain the biggest headwind for growth stocks.
🛢️ 3. Oil Near $100
Crude oil remains elevated as supply concerns persist, keeping inflation worries alive and putting pressure on the Fed outlook.
🏦 4. Focus This Week
Markets will be watching:
• ISM Services PMI
• Fed speakers & meeting minutes
• The start of Q3 earnings season (Delta among the early reporters)
━━━━━━━━━━━━━━
💭 My Take
Friday's weak jobs report helped stocks.
This week is all about yields.
📉 Falling yields = Bullish for AI & Tech
📈 Rising yields = More market volatility
Watch the bond market first. The stock market usually follows.
#StockMarket #SP500 #NASDAQ #NVDA #AI #Fed #Investing #Stocks
🛢️ Morning Macro | October 4, 2026
OPEC+ keeps November oil production unchanged.
The group decided to leave November output quotas unchanged for a second straight month, signaling a cautious approach as it continues to monitor global supply and demand.
━━━━━━━━━━━━━━
📊 What It Means for U.S. Stocks
🟢 Energy Stocks
• Stable oil prices could support names like XOM, CVX, COP, SLB.
🟡 Inflation
• No surprise increase in supply means oil prices are unlikely to fall sharply.
• Energy inflation could stay elevated if geopolitical risks persist.
🔴 Fed Outlook
• If oil remains above recent levels, inflation may cool more slowly.
• That could keep pressure on Treasury yields and limit upside for high-valuation growth stocks.
━━━━━━━━━━━━━━
💭 My Take
This decision is slightly positive for energy stocks, but mixed for the broader market.
The bigger risk isn't OPEC+ itself—it's whether oil prices stay elevated.
🛢️ Higher oil = Higher inflation risk
📈 Higher inflation = Higher bond yields
📉 Higher yields = More pressure on tech and AI stocks
I'll be watching oil and the 10-year Treasury yield more closely than today's headlines.
#StockMarket #OPEC #Oil #SP500 #NASDAQ #XOM #CVX #Energy #Investing #Macro
💊 Pharma Stocks | Swing Trade Watch
📅 October3, 2026
Healthcare has quietly started outperforming as investors rotate into defensive growth. Here are the pharma names I'm watching from a technical (price action) perspective.
🟢 $LLY
• Long-term uptrend remains intact.
• Pullbacks are finding buyers above key support.
• Bias: Bullish while holding higher lows.
🟢 $ABBV
• Trading inside a rising channel.
• Consolidation after the recent advance looks healthy.
• Bias: Buy-the-dip candidate.
🟢 $MRK
• Base-building after recent weakness.
• A breakout above recent swing highs could start a new leg higher.
• Bias: Neutral → Bullish on breakout.
🟢 $JNJ
• Higher lows continue to form.
• Defensive strength could attract capital if volatility returns.
• Bias: Steady uptrend.
📈 My Mid-Term Favorite
🥇 LLY remains my top pick.
Strong trend, strong momentum, and every meaningful pullback has been bought. Until the daily chart breaks its higher-low structure, I prefer staying with the trend.
#LLY #ABBV #MRK #JNJ #Healthcare #Pharma #Stocks #Investing #SwingTrading #TechnicalAnalysis
🇺🇸 US Market Recap | October 2, 2026
📈 Stocks finished higher after a weaker-than-expected September jobs report eased fears of another Fed rate hike. Investors shifted back into growth and AI names.
📊 Major Indexes
• S&P 500: +0.73%
• Nasdaq: +1.19%
• Dow Jones: +0.49%
🔥 Market Highlights
• AI & tech led the rally.
• Treasury yields fell after NFP, then rebounded into the close.
• Tesla outperformed, while Nike lagged after weak guidance.
👀 My Take
Today's rally was driven more by Fed expectations than fundamentals. If bond yields continue to cool, bulls stay in control. If yields rebound, expect volatility to return.
#StockMarket #SP500 #NASDAQ #DowJones #NVDA #TSLA #AI #Investing
📈 $LLY Technical Analysis
📅 October 2, 2026
━━━━━━━━━━━━━━━━━━
💰 Current Price: ~$1,153
🟢 Support: $1,140
🔴 Resistance: $1,200
━━━━━━━━━━━━━━━━━━
📌 My View
LLY is trading above a key support zone after a healthy pullback from its all-time high.
As long as $1,140 holds, the medium-term uptrend remains intact.
A decisive breakout above $1,200 could attract fresh momentum buyers and put the previous highs back in focus. LLY has recently traded around $1,150 after pulling back from a 52-week high near $1,293, while analysts broadly remain constructive on the stock.
━━━━━━━━━━━━━━━━━━
👀 Key Levels
🟢 Support: $1,140
🔴 Resistance: $1,200
━━━━━━━━━━━━━━━━━━
💭 Trading Plan
✅ Hold above $1,140 = Bullish bias
🚀 Break above $1,200 = Potential trend continuation
━━━━━━━━━━━━━━━━━━
What's your outlook on $LLY?
$LLY #LLY #Stocks #StockMarket #TechnicalAnalysis #Trading #Investing

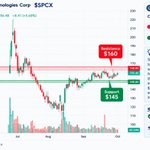
📈 $SPCX Technical Analysis
📅 October 2, 2026
━━━━━━━━━━━━━━━
💰 Current Price: $152.31
🟢 Support: $145
🔴 Resistance: $160
━━━━━━━━━━━━━━━
📌 My View
SPCX has been consolidating after a strong rebound from its August lows.
As long as $145 holds, the short-term trend remains constructive. A clean breakout above $160 would confirm renewed bullish momentum and could open the door to another leg higher. Recent analyst sentiment has also improved following successful Starship progress, though the stock remains volatile. (Investor's Business Daily)
━━━━━━━━━━━━━━━
🎯 Key Levels
🟢 Support: $145
🔴 Resistance: $160
━━━━━━━━━━━━━━━
💡 Trading Plan
✅ Above $145 → Bullish structure remains intact.
🚀 Above $160 → Watch for breakout continuation.
━━━━━━━━━━━━━━━
Are you bullish or bearish on $SPCX?
$SPCX #SpaceX #Stocks #StockMarket #TechnicalAnalysis #Trading #Investing

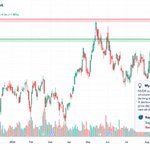
📈 $NVDA Technical Analysis
📅 October 2, 2026
━━━━━━━━━━━━━━
💰 Current Price: ~$230
🟢 Support: $224
🔴 Resistance: $236
━━━━━━━━━━━━━━
📌 My View
NVDA continues to respect its higher-low structure and remains in a strong uptrend.
As long as $224 holds, bulls remain in control.
A decisive break above $236 could trigger price discovery and extend the rally toward new all-time highs. Nvidia shares have recently been approaching record highs amid continued optimism around AI demand and positive analyst sentiment. (Barron's)
━━━━━━━━━━━━━━
🎯 Key Levels
🟢 Support: $224
🔴 Resistance: $236
━━━━━━━━━━━━━━
💡 Trading Plan
✅ Above $224 → Bullish trend remains intact.
🚀 Break above $236 → Watch for a momentum breakout.
━━━━━━━━━━━━━━
Are you buying the breakout or waiting for a pullback?
$NVDA #NVDA #NVIDIA #Stocks #StockMarket #TechnicalAnalysis #Trading #Investing
