

cooking unrealised profits since 2021 my telegram for cooperation: @abclogic
join my tg →
Joined May 2025
- Tweets5.8K
- Following66
- Followers2.1K
- Likes7K






Everyone sees the +1,759% on this $NEAR chart.
I'm looking at something else.
$3.29.
That's the first level $NEAR needs to reclaim.
Right now, it's trading at $2.68 after another sharp rejection.
But if buyers manage to turn $3.29 into support, the bigger picture gets interesting.
My upside targets:
$3.29 — First breakout level
$8.90 — Major resistance
$20.64 — Previous cycle high
$40 — Extreme bullish scenario
That final target represents a potential +1,759% move from the chart's marked base. It's an aggressive projection, not a confirmed setup.
The real question isn't whether $NEAR can reach $40.
It's whether this is the last shakeout before the next major rally.

2
50
$TRUMP went from being the loudest coin in crypto to trading at $1.64.
And now we're drawing a $77 target. LMAO. 💀
$16.33 → $30 → $77.
That's a potential 40x+ comeback if the most ridiculous bullish scenario plays out.
Right now, this chart looks like everyone left the party.
But if meme coin mania returns, things could get very interesting.
Never underestimate crypto's ability to make absolutely no sense.

2
2
527
$TAO is getting squeezed into a corner, and I don't think it'll stay quiet for much longer. 👀
Lower highs. Higher lows. Two years of bulls and bears fighting over the same territory.
But that rising support keeps catching my attention.
If buyers finally take control, $900+ becomes my wild bull-case target.
A potential 5x from here.
The longer this thing coils, the more interesting the eventual breakout gets.

$FET AT $0.19. IMAGINE SELLING HERE AND WATCHING IT HIT $6.
That's the kind of move that makes people regret ignoring a chart.
$FET has spent years going through brutal rallies and corrections. Now it's back near its historical liquidity zone.
And I think this is where things could get interesting.
The weekly chart shows a potential recovery path toward $3, followed by $6 if momentum returns.
That's over 30x from current prices.
Of course, a chart doesn't guarantee anything. But the risk/reward scenario is worth watching.
I've seen the market turn forgotten altcoins into the biggest winners before.
Would you hold $FET all the way to $6?

$FIL at $1.07, and this chart is absolutely ridiculous.
Imagine telling someone who bought Filecoin above $100 that we're now trading around $1.
They'd probably never touch crypto again.
But here's what caught my attention.
$FIL has spent years bleeding into what looks like a massive historical support zone.
My long-term targets:
🎯 $118.86
🎯 $237.39
🎯 $430.21
The most aggressive scenario on this chart suggests +35,665% potential from the marked base.
Do I think that's likely? No. It would require an extraordinary comeback, and there's no confirmation of a reversal yet.
But crypto has a habit of making the impossible look obvious in hindsight.
Is $FIL a forgotten opportunity or a coin that's never coming back?

Nobody needs $TIA to hit $34 for this trade to become insane.
It's sitting at just $0.34.
And the first major historical target is already $9.24.
That's over 27x from here.
Now look at the bigger picture.
$TIA has spent years bleeding from its $21 peak, and price is approaching the bottom of a multi-year structure.
The levels I'm watching:
$9.24 — First target
$11.89 — Second target
$21.12 — Previous major high
$34 — Extreme bullish scenario
The chart shows a potential +10,016% move from the marked base.
Of course, the market needs to confirm a reversal first.
But here's the real question:
What if the biggest $TIA opportunity comes when absolutely nobody believes in it?

Nobody talks about $AERO when it's at $0.43.
But they'll definitely talk about it if it hits $4.
The weekly chart shows price returning to a key liquidity zone after another rejection near $1.
Now the question is whether buyers can defend this level.
The extreme bullish projection? +1,325% from the marked base.
My targets:
$0.6315 — Target 1
$1.5823 — Target 2
$2.2198 — Target 3
$4.40+ — Extreme bull scenario
The setup still needs confirmation. Losing this support could invalidate the bullish case.
But if $AERO reclaims $0.63, the recovery could start getting interesting.
Would you accumulate here or wait for confirmation?

A $37 coin with a $1,600 target.
Sounds impossible?
Take a look at $DASH.
Years of trading near a historical discount zone, while the long-term trendline points toward a potential massive recovery.
The extreme bullish projection? +4,669%.
My targets:
$200 — First major resistance
$500 — Recovery checkpoint
$1,000 — Bullish continuation
$1,600+ — Extreme bull scenario
Of course, a breakout isn't confirmed. $DASH still needs to reclaim major resistance levels.
But if the next altcoin cycle brings old coins back to life, $DASH could be one to watch.
Would you bet on this comeback?

11
671
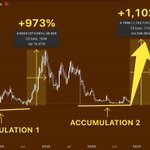
The last time $SUI looked like this, it went up 973%.
Now look at the chart again.
2024: Accumulation → +973% rally.
2026: Back in a similar accumulation zone.
What if history repeats itself?
The potential upside from the marked base is +1,102%.
My targets:
$1.50 — First resistance
$3.00 — Bullish continuation
$5.30 — Previous major high
$6.30+ — Extreme bull scenario
Nothing is confirmed yet, but this setup is worth watching.
Could $SUI pull off another 10x?

$WLD is trading around $0.26.
After a brutal downtrend, $WLD is sitting near its historical discount zone.
The weekly chart suggests a potential reversal setup.
The projected upside? +8,691% from the marked historical base.
My targets:
$2.19 — Target 1
$4.23 — Target 2
$11.96 — Target 3
$20+ — Extreme bull scenario
First, buyers need to reclaim $0.50 and confirm a bullish reversal.
The projection is extremely speculative, especially with token unlock risks.
But if this discount zone holds, $WLD could be preparing for another major rally.

$NEAR is trading around $3.36.
After years of consolidation, $NEAR is approaching a key breakout level on the weekly chart.
The projected upside? +1,759% from the marked historical base.
My targets:
$3.293 — Target 1
$8.909 — Target 2
$20.644 — Target 3
$39+ — Extreme bull scenario
Buyers need to hold above $3.29 and build momentum toward $8.90.
The projection is highly speculative, but if support holds, $NEAR could be preparing for another major rally.

$SEI is trading around $0.039.
After years of decline, $SEI is back near its historical liquidity pool.
The weekly chart suggests a potential reversal.
The projected upside? +6,012% from the marked historical base.
My targets:
$0.39050 — Target 1
$0.73460 — Target 2
$1.14196 — Target 3
$2.17+ — Extreme bull scenario
First, buyers need to reclaim $0.10 and confirm bullish momentum.
This is a highly speculative scenario, but if support holds, $SEI could be setting up for a major rally.

$PEPE is trading around $0.00000384.
And something interesting is happening on the weekly chart.
In 2024, $PEPE broke out of accumulation and rallied 2,334%.
Now we're seeing a similar accumulation structure forming again.
The next potential move? +2,571%.
My targets:
$0.000010 — First resistance
$0.000016 — Major breakout level
$0.000028 — Previous ATH
$0.000055 — Extreme bull scenario
First, buyers need to confirm a breakout with strong volume.
Nothing is guaranteed, but if history repeats, $PEPE could have another explosive rally ahead.

$XLM is trading around $0.138.
After years of consolidation and failed rallies, $XLM is approaching a major historical liquidity zone.
The weekly chart shows a long-term ascending structure with significant upside potential.
The projected upside? +3,958% from the marked historical base.
My targets:
$0.35 — First resistance
$0.80 — Previous major high
$1.50 — Bullish continuation
$2.20+ — Extreme bull scenario
First, buyers need to reclaim $0.20 and confirm a bullish reversal.
The projection is highly speculative, but if this liquidity zone holds, $XLM could be preparing for another major expansion.

$FET is trading around $0.13.
And this weekly chart is showing a potentially massive opportunity.
In 2021, $FET made its first major peak.
In 2024, it reached a new ATH above $3.
Now price has returned to its historical discount zone.
Could the third cycle push $FET toward $7?
My targets:
$0.50 — First resistance
$1.00 — Recovery checkpoint
$3.50 — Previous ATH region
$7.00 — Potential ATH 3
First, buyers need to reclaim $0.30 and confirm a bullish reversal.
The $7 projection is highly speculative, but if this support holds, the next cycle could be interesting.

$PYTH is down over 95% from its previous highs.
And now it's sitting right at a major historical liquidity pool.
After nearly three years of lower highs and relentless selling pressure, the weekly chart is approaching a potentially important reversal zone.
The upside projection? +4,004% from the marked historical base.
My targets:
$0.24029 — Target 1
$0.54097 — Target 2
$1.15435 — Target 3
$2.60+ — Extreme bull scenario.
First, I want to see buyers reclaim $0.10 and confirm a shift in market structure.
Until then, the downtrend remains intact.
A 40x move is highly speculative, but if this liquidity zone holds, $PYTH could become one to watch.

$WLD is trading around $0.269.
And this weekly chart is showing a potentially massive reversal setup.
After reaching above $11 in 2024, $WLD entered a brutal downtrend.
Lower highs. Failed recoveries. Years of selling pressure.
But here's what caught my attention.
Price has returned to a major historical liquidity zone, where a new accumulation phase could potentially develop.
The chart projects an extreme 5,588% expansion from its marked reference point.
Here's my roadmap:
$0.50 — First resistance.
$1.00 — Recovery checkpoint.
$2.1914 — Target 1.
$4.2360 — Target 2.
$11.9601 — Target 3.
$18+ — Extreme bull scenario.
But first, buyers need to establish higher lows and reclaim $0.50 with strong volume.
A sustained breakout above $1 would strengthen the bullish case.
Until then, the broader downtrend and token supply dilution remain significant risks.
The 5,588% projection is highly speculative, not a guaranteed outcome.
Still, if this historical liquidity zone holds, $WLD could be approaching an important turning point.
The market has spent years moving down.
Could the next major cycle finally change that?

$XPL is trading around $0.044.
And this daily chart is showing an extreme long-term reversal setup.
In September 2025, $XPL reached an all-time high of $1.69.
Then came a brutal collapse.
Price lost nearly 95% of its value, with months of relentless selling pressure.
But here's what caught my attention.
$XPL is now sitting near its historical discount zone, where price has been consolidating after the massive decline.
The chart projects a potential 6,128% expansion from its marked reference point.
Here's my roadmap:
$0.10 — First resistance.
$0.25 — Recovery checkpoint.
$0.50 — Major resistance.
$1.00 — Psychological milestone.
$1.69 — Previous ATH.
$2.00 — Bullish continuation.
$4.20+ — Extreme bull scenario.
But a 95% correction doesn't automatically mean the bottom is in.
I want to see $XPL reclaim $0.10, establish higher lows, and show sustained buying volume before considering a genuine reversal.
Until then, further downside remains possible.
The 6,128% projection is extremely speculative, not a guaranteed outcome.
Still, if this discount zone holds and buyers regain control, $XPL could be approaching an important turning point.
The market has spent over a year moving down.
Now the question is whether a new cycle can finally begin.

$XLM is trading around $0.139.
And this weekly chart is showing a massive long-term setup.
Look at the bigger picture.
Since 2018, $XLM has experienced multiple explosive rallies, followed by years of corrections.
But here's what's interesting.
Despite all these market cycles, price keeps returning to the same historical liquidity zone.
And now we're testing that region again.
The chart highlights a potential 4,302% expansion from its marked historical base.
Here's my roadmap:
$0.20 — First resistance.
$0.35 — Initial breakout target.
$0.63–0.80 — Major historical resistance.
$1.00 — Psychological milestone.
$1.50 — Bullish continuation.
$2.30–2.50 — Extreme bull scenario.
But first, buyers need to prove themselves.
A weekly reclaim of $0.20 would be encouraging. Breaking above $0.35 with strong volume would make the bullish case much more interesting.
Until then, the risk of further downside remains.
The 4,302% projection is highly speculative, not a guarantee.
But if this multi-year liquidity zone holds and buyers regain control, $XLM could be setting up for another significant cycle.
The question is whether history is preparing to repeat itself.

$ZEC is trading around $994.
And this weekly chart is approaching one of its most important technical levels.
After a powerful rally toward $1,600, $ZEC has entered a correction.
Price has pulled back significantly, and short-term momentum has weakened.
But look at the bigger picture.
Despite the recent selling pressure, the broader bullish structure hasn't completely broken down.
$ZEC is now testing a rising support trendline that has been developing since the previous major breakout.
And that's exactly where I'm paying attention.
This isn't just another random price level.
It's an area where buyers need to prove they're still in control.
Here's what I'm watching.
$1,000 — Immediate support that needs to hold.
$1,250 — First resistance to reclaim.
$1,500–1,600 — Previous major highs.
$2,000 — Potential continuation target.
$2,500 — Next major upside objective.
And $3,000? That's my aggressive bull scenario.
But there's one important condition.
If $ZEC loses the rising weekly support and fails to reclaim it, the bullish structure becomes much less convincing.
On the other hand, a strong reaction from this area followed by a break above $1,600 could open the door to another major expansion.
What makes this chart interesting is the contrast between the short-term correction and the longer-term trend.
Strong markets don't move in straight lines.
They rally, consolidate, test support, and then reveal whether buyers still have enough strength to continue.
Right now, $ZEC is at exactly that kind of decision point.
The $3,000 target is speculative.
The reaction around $1,000 is what matters first.
