







chris.trading.pp retweeted

The early day rally in $SPY without first undercutting yesterday’s low looks suspicious to me. I doubt it holds without at least an undercut and some additional downside testing.
But in all honesty, with my stops now at breakeven and zero risk on my shorts, if you gave me a choice between getting stopped out at breakeven and keeping the bull market alive, or making a quick profit while the market enters a prolonged bear market, I’d choose to get stopped out - nothing gained, nothing lost.
Why?
Because there are much bigger, and far more numerous opportunities in individual stocks during a healthy bull market than there are from profiting on a quick index short trade.
I’m positioned to profit if the market continues lower, but I’m certainly not rooting for it. Give me a healthy bull market with a broad field of quality setups... that’s where the real money is made.


chris.trading.pp retweeted

One thing that still feels under discussed is how much Jensen was functioning as the central bank of AI.
He was not just selling chips. He was underwriting the build out. Residual guarantees, capacity backstops, and the push to make compute an investable asset class. He reduced financing friction and supported the confidence premium.
Yeah, the product franchise is still there but the underwriting part just got a lot less certain.

chris.trading.pp retweeted

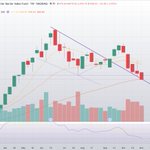
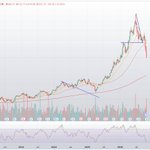
The last BD on $MRVL gave us a ~260% rally before our sell signal came in.
We're now down 52% while the next blue diamond loads.
Wouldn't surprise me if we saw a reversal at this major support zone.

chris.trading.pp retweeted
Mostly a fire to the downside 🥵. But positive RSI divergence and if it can reclaim 8sma that's a good start. But honestly feel quantum names tend to run late so not hugely optimistic this will the leader out of this correction barring big news


Reposting because I want it to be true 🫠

SOXL's 13week return crossed below -67% today.
This is an exceptionally rare event, occurring only five times in the available history. While the sample size is small, the forward return profile has been remarkably consistent. Every prior occurrence produced a positive return from week 1 through week 10. Whether this instance follows the same path remains to be seen.
Historically, average returns accelerated from 28.6% after one week to 54.0% after three weeks, 81.0% after four weeks, and 117.5% after ten weeks. The median outcome was similarly impressive.
These signals have historically occurred during periods of extreme pessimism, forced liquidations, and trend exhaustion.


31
chris.trading.pp retweeted
Love the $NBIS company vision but charts look like 💩
Daily looks like that horizontal level must hold but no signs of capitulation. Weekly very ugly candle with close below 50sma. Monthly suggests $136 support could be tested


$NBIS we have arrived
Below this on a monthly close could get super ugly. For me I'm adding to my position

104
Armchair / Amitchair economics

If you are wondering why Oil is down 8%…
1. Oil is up because of a war.
2. Trump has no political capital to keep that war going.
3. The country shifted so far blue that they now have a mandate to end this war.
4. If the war ends, even with refinery issues, oil prices will come down.
5. If oil goes down, so does inflation. If inflation goes down…stocks benefit.
The semis are down due to datacenter sentiment but the broader market seems to like this setup.
Basically, arbitrary oil induced inflation seems to be coming to an end as even Trump last night acknowledged he wants to get a deal and Vance today said the Iran war was a mistake.
1
2
70
chris.trading.pp retweeted
$QQQ still needs to get over 700 but trapped in negative gamma is why so volatile hour to hour... the Spotgamma vol trigger there is clear up at 714 so still has alot to achieve.
While $SPY also above its vol trigger of 762 and clearly more stable.. this is the stuff that matters.. but VIX futures staying on the lows is good here
Non-US citizen, observing from afar, feels like Charlie Kirk's tragic assisnation and "El Hakimo Jefe Jeffries" meme were high point of what has otherwise been a catastrophic failure of Republicans to capitalise on their control of the Capitol
xitter.gq/realDonaldTrump/status…

50
$CYPH $ZEC disgusting move down the bounced right back. Crypto looks strong today, odd because it's a "trump trade"
Don't hate
$CYPH($ZEC treasury). Daily nice solid bounce of 50sma but weekly still struggling for close above 8sma. Zoom out to monthly and looks like decent breakout still in play.


1
103


Closed v close to 50sma and now rallying overnight to the 463.8 level which was the July low. Break that and 200sma should be retested from below around $477. For now pressure remains down but bullish RSI divergence on daily chart and oversold levels that usually bounce

$SOXX ($SMH) daily looks like capitulation on volume w/bullish RSI divergence. Close under 200sma bear trap? Better hope...weekly chart maybe more pain ahead...3 weeks of high volume selling, 50sma in play which also lines up with a full retest of that previous breakout


1
64